
Not all triangle patterns are as powerful and reliable. In fact, triangle patterns often fail to deliver. However, there are 3 secret characteristics of those which are highly reliable. The profits that these triangles bring are usually massive, out-sizing the amount of risk.
Before diving in to the 3 secret characteristics, you’ll need to know how triangle chart patterns look like and the 2 most common types of triangles.
Spot It Right
#1 Ideal Symmetrical Triangle

Characteristics
- At least 4 swings (up and down)
- Each peak is lower than the previous and each bottom higher than the previous
- Prices and volume diminish as the pattern is formed
- Prices and (usually) volume move sharply upon the breakout (only for a bullish breakout)
#3 Ideal Right-Angled Triangle
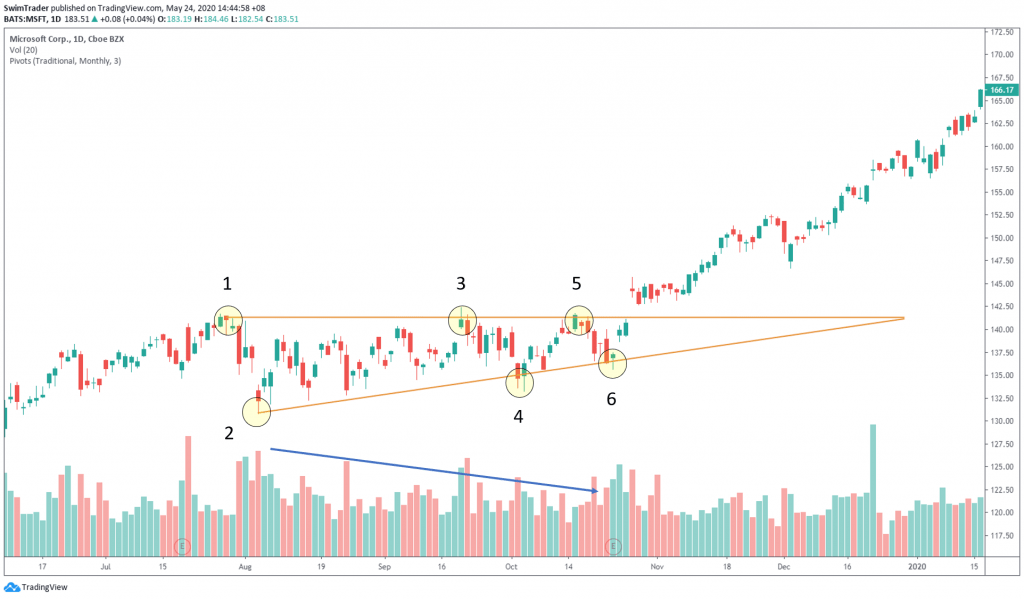

Characteristics
- At least 4 swings (up and down), with one of the lines being horizontal, hence the name of this triangle pattern
- Each peak is lower than the previous and each bottom higher than the previous
- Prices and volume diminish as the pattern is formed
- Prices and (usually) volume move sharply upon the breakout (only for a bullish breakout)
What Happens Inside The Triangles?
In a bullish triangle, the bulls an bears are having a massive fight. Initially, the bulls look to be winning, but the bears won’t give up without a fight. As the bulls push prices up to a certain level, the bears step in, pushing prices down. The same cycle repeats, forming a triangle.
In a bearish triangle, the bears force prices down before the bulls wake up to push prices back up. This cycle repeats, forming a triangle.
3 Secret Characteristics
You have learnt how to identify and differentiate the 2 main types of triangles. You are ready to discover what the 3 secret characteristics are.
These 3 secret characteristics improve the reliability of the pattern:
- The nearer the breakout occurs to the apex, the better
- The more prices touch the lines, the better
- Be wary if the volume is low during the bullish breakout
Show Me The Money

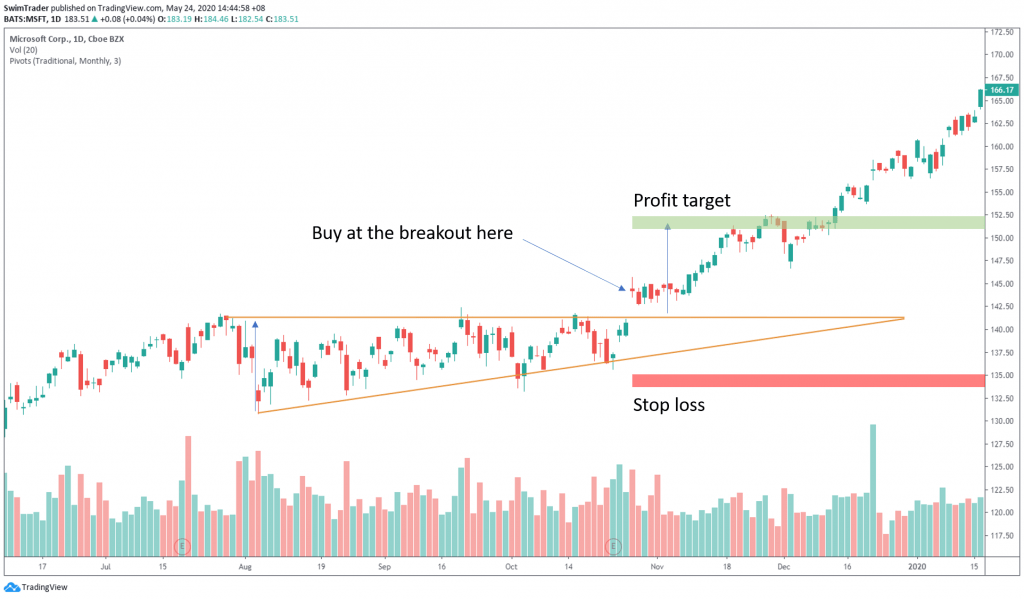

Only trade breakouts.
Steps:
- Watch for price to break the triangle pattern line
- Enter your position according to the direction of the breakout the next session
- If you are trading using the hourly chart, enter the trade an hour later
- If you are trading according to a daily chart, enter the trade on the next day
- Set your stop loss
- Set a profit target (based on the height of the triangle as shown)
- Yes, you may set your profit target farther out for more profits
Conclusion
After spotting a triangle pattern, look for the 3 secret characteristics. Take a position if they are present and this might just be your best trade of the year.
Here’s What You Can Do To Improve Your Trading Right Now:
#1 Register for our market outlook webinars by clicking here
#2 Join us in our Facebook Group as we can discuss the various ways of applying this by clicking here
#3 Never miss another market update; get it delivered to you via Telegram by clicking here
#4 Grab a front row seat and discover how you can expand your trading arsenal in our FREE courses (for a limited time only) by clicking here
Trade safe!
