
Swing trading relies on technical analysis. This means that you will be analyzing charts. While you could use the charts that your broker provides, there’re some limitations when compared to stand alone charting platforms.
A side note, you’ll need a brokerage account. CMC Markets, IG Markets, Phillip Securities, and Tiger Brokers usually take a couple of hours to 3 working days to process your application. Some other brokers may take weeks, so open one now to get started.
Now, let’s look at the 5 most important features of a good charting platform!
#1 Easy To Use
Time is precious. You won’t want to spend a large amount of time learning how to use a complicated or complex charting platform.
The charting platform you use should be clean, intuitive, and fast. It’s that simple.
#2 Cloud Based

Having a charting platform which is cloud based is a huge advantage. A cloud based charting platform means that you can view your charts and analysis across multiple devices as long as you are connected to the Internet. Your charts and analysis will sync across your devices for convenience.
I was out one weeknight to run errands when a good friend of mine (who’s also a trader) sent me a text notifying me of a sudden drop in the US stock market. As the charting platform I was (and am still using) using is cloud based, I could tell from my analysis if I should continue holding onto my trades or dump them immediately.
This is especially important when you travel. You don’t have to bring your laptop with you, reducing the weight of your luggage. You can easily refer to your charts and analysis using your phone.
#3 Extensive Database

What should your charting platform have in its database?
a) Stocks
b) Indices
c) Exchange traded funds (ETFs)
d) Commodities
e) Currencies
f) Indicators
Yes, let’s not forget about the indicators. Indicators can be useful in spotting strength and weakness of the instrument you wish to trade (stocks, ETFs, indices, commodities, and currencies). Indicators such as MACD, Volume, and RSI can notify you of an impending change in trend via divergence.
Which indicators are helpful? Which should you use and how do you use them? In Indicator Secrets, you’ll learn about 10 helpful and easy to use indicators. These indicators must be available in the charting platform you use.
#4 Customization

Customization includes color, thickness of lines, and the ability to annotate.
You’ll want to be able to customize your drawings so that you know what you know what you can better spot trading opportunities.
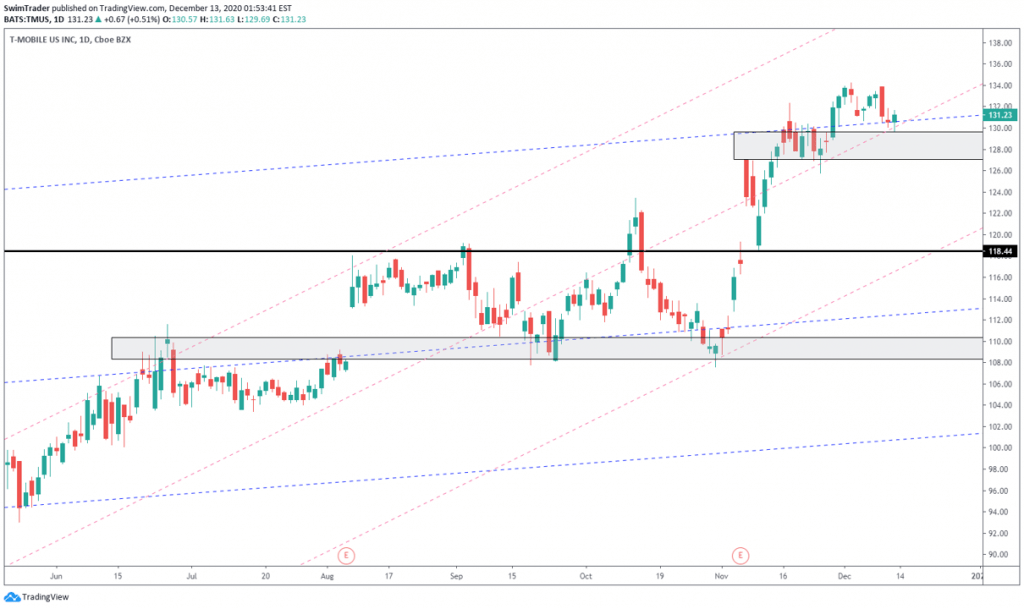
For example, my long-term trendlines are in dotted blue while my short-term trendlines are in dotted pink. My long-term support and resistance zones are in bold while my short-term support and resistance zones are in grey boxes.
Your charting platform should allow you to customize the duration of indicators too. The default period for a simple moving average (SMA) is 20. Your charting platform should allow you to change it to a 30 period SMA.
The default period for the Relative Strength Index (RSI) indicator is 14. You should be able to increase the period of the RSI indicator to 21 if you intend to hold onto your trade for a longer period of time.
Customization will provide you with the freedom to use the period that you are most comfortable to trade with.
#5 Length Of Chart Data
Some charting platforms provide charting data that goes back for a couple of years. To be successful at swing trading, you’ll want at least 5 years worth of charting data. Why?
You’ll want to know the characteristic of the stock you are going to swing trade on. Has this stock been volatile all these while? Where are the weekly resistance zones? Has this stock been trending or stuck in a type 4 market for years?
Learn about the 4 different market types and how you can trade in those 4 market types.
Bonus
#6 Screener

If the charting platform you use has a screener, you’ll be able to unearth potential winning stocks, saving you a lot of time.
What should you be filtering for? How do you do that?
I am working on an e-book on filtering for strong stocks to swing trade. Drop me an email with the subject title “Filtering Strong Stocks E-book” and I’ll send you a copy when it is out.
Here’s What You’ve Learnt Today
A good charting platform can add an edge to your trading proficiency. Ideally, the charting platform which you use should be easy to use, cloud based for connectivity and mobile usage, have an extensive range of instruments and indicators, customizable drawing tools and period of indicators, have years of chart data, and a screener.
And, TradingView has all the features mentioned above. There’s a free version which is all you need.
Here’s What You Can Do To Improve Your Trading Right Now:
#1 Register for our market outlook webinars by clicking here
#2 Join us in our Facebook Group as we can discuss the various ways of applying this by clicking here
#3 Never miss another market update; get it delivered to you via Telegram by clicking here
#4 Grab a front row seat and discover how you can expand your trading arsenal in our FREE courses (for a limited time only) by clicking here
Trade safe!
