
Can you recall what C in the SECURE acronym stands for?
Need a hint? C is a sector in the stock market that’s resilient in good and bad economic times.
Yes, C stands for Consumer Staples.
Want to know what the SECURE acronym is and how you can make passive income from the US stock market, visit this recent article.

Using the SECURE framework, you’d have eliminated hundreds of stocks in the S&P 500, narrowing the number of stocks you should focus on to generate passive income. Couple this framework with these 7 criteria, you’ll find a bag full of gems to invest in.
Shall we look at a stock in the consumer staples sector which fulfills all 7 criteria? This rising star is none other than The J M Smucker Company (SJM).
Let’s see how SJM performs for each criteria.
#1 Defensive Stock
Being in the consumer staples sector, SJM is naturally a defensive stock.
SJM is in the food and beverage business for humans and pets. This is a pretty resilient business.
So SJM passes this criteria.
#2 Stable Profit Margin
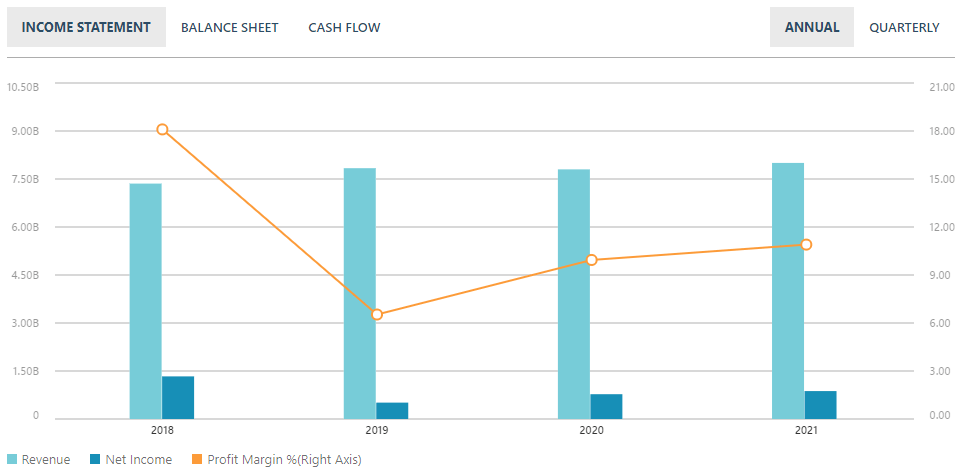
SJM has proven to be a resilient business. SJM enjoyed positive profit margin in year 2020 and 2021 while the COVID-19 pandemic was on-going.
Displayed in the graph below (courtesy of MSN Money), we can see that SJM had achieved a profit margin of 18% in 2018, 6% in 2019, 10% in 2020, and 11% in 2021. Its profit margin is not only stable; it has actually increased during the pandemic!
#3 Stable Positive Free Cash Flow
You can also get this information from MSN Money.
Under the section titled Cash Flow, you’ll see that SJM has a stable and growing positive free cash flow!
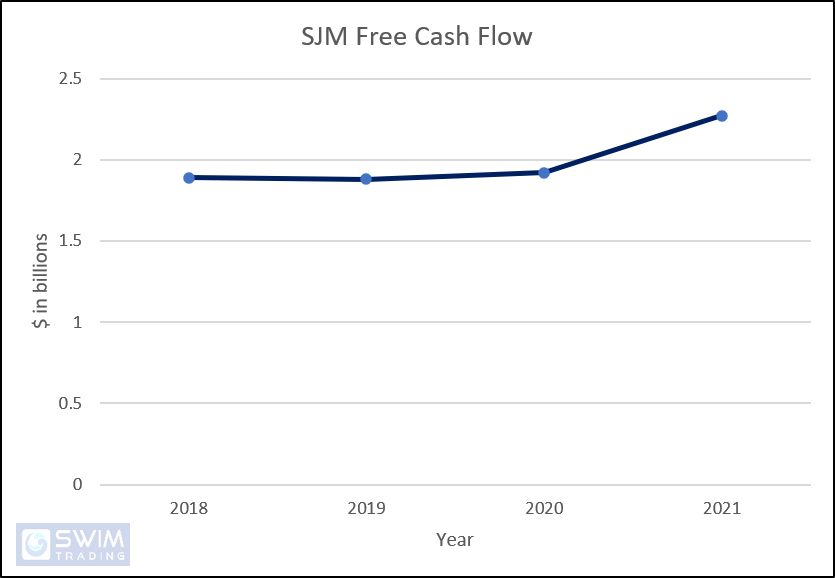
This numbers tell us that SJM is making money and has a war chest to innovate and/or invest in other companies. SJM is financially strong.
#4 Stable Dividend Payout
SJM’s dividend payout over the years is impressive! While the dividend payout of many companies has been shrinking over the years, SJM has been increasing its dividends payout (per share and in total).
In that chart below, you’ll see the dividend payout by SJM in the recent 4 years.
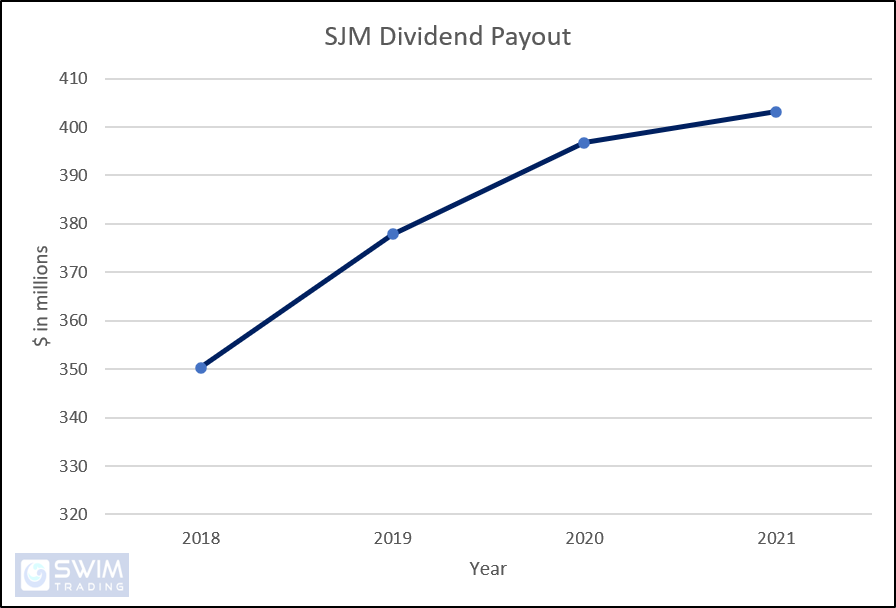
This data can be found in MSN Money, under the section Cash Flow.
#5 Dividend Payout Ratio
Getting paid dividends is good! However, if dividends are paid by borrowing, it’s a red flag.
The dividend payout ratio helps to point this out. If the ratio is more than 100%, the company is financing its dividend payout through the use of debt. You’ll want this ratio to be less than 100%.
Luckily SJM isn’t borrowing money to pay out dividends to its shareholders.

#6 Interest Expense Ratio
When a company borrows money, it has to pay interest. If the interest amount is huge, it can possible cripple a company.
Hence, you want this ratio to be low. How low? Lower than 40%.
SJM fulfills this criteria too! Its interest expense ratio has been kept under 40% from 2018 to 2021.
#7 Timing Your Investment
Knowing when to buy is critical. This is when trends and signals are your best friends.
When you invest while the stock price is on a downtrend, you lose money. It can be a lot of money.
When you invest on an uptrend, your risk is lowered. This allows you to sleep peacefully at night. Having this peaceful sleep provides you with the ability to focus at work and quality time with your loved ones.
From the weekly chart of SJM below, you can tell that prices of SJM have been trending downwards for 3 years.
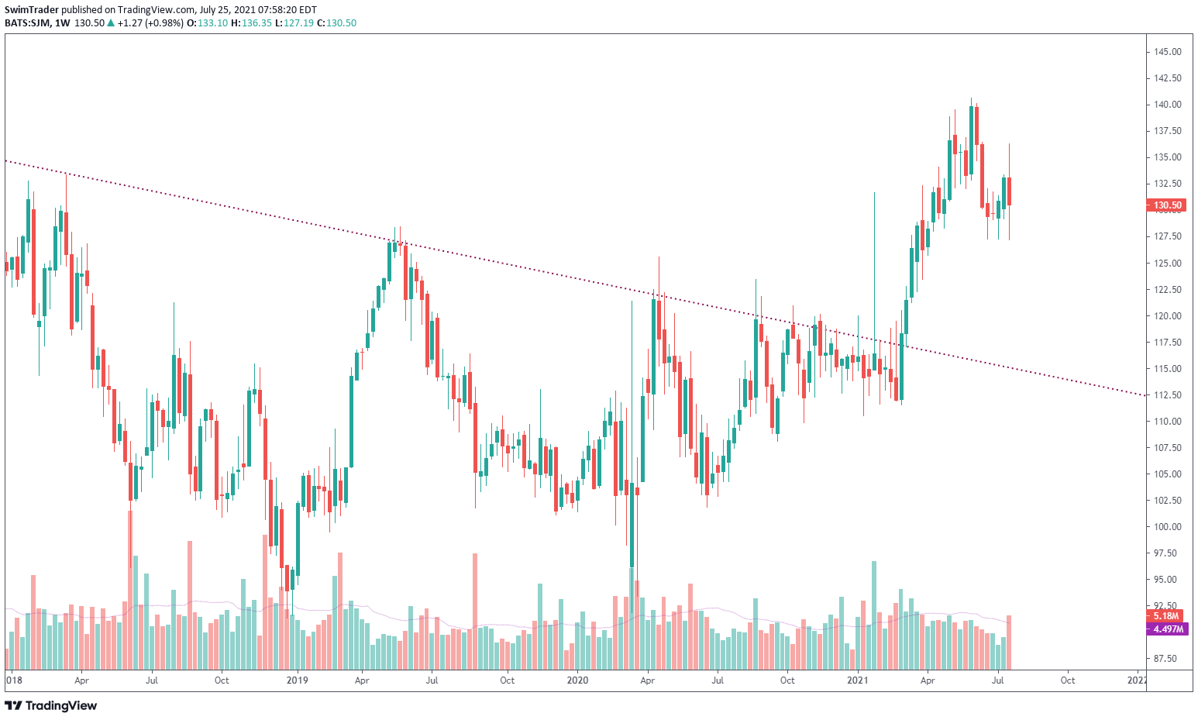
This means that if you’d bought SJM prior to 2021 (without applying technical analysis), there’s a chance that you’ve been sitting on losses up till the recent months. And that’s gut-wrenching.
Does this mean that you should focus on technical analysis and forgo fundamental analysis?
No.
Fundamental analysis can tell you if a company is solid or heading towards needing emergency rescue to stay afloat.
The weekly TPB Swing strategy can help you point out opportune moments to invest in any US stock through the TPB signals and Strength Meter (those colored bars at the bottom).
The TPB signal comes on when a possible uptrend or downtrend continuation is about to take place. The Strength Meter indicator shows the strength of the stock.
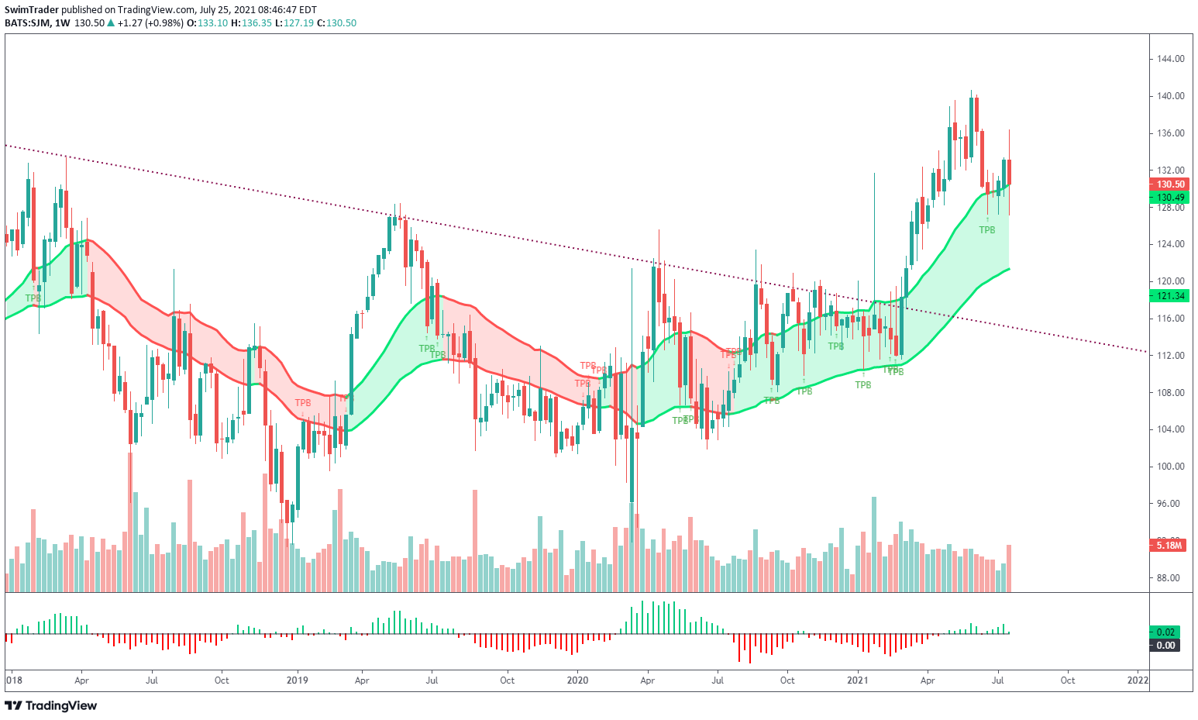
As you can see, the weekly TPB Swing strategy suggests that the price of SJM is at a sweet point for an investment. This is after SJM’s multi-year downtrend line has been broken.
3 Things You Must Remember
#1 Not all stocks in the consumer staples sector are equal
#2 Pair fundamental analysis with technical analysis for an edge in the stock market
#3 Use the weekly TPB strategy to help you spot optimal investment points
Here’s What You Can Do To Improve Your Trading Right Now:
#1 Register for our market outlook webinars by clicking here
#2 Join us in our Facebook Group as we can discuss the various ways of applying this by clicking here
#3 Never miss another market update; get it delivered to you via Telegram by clicking here
#4 Grab a front row seat and discover how you can expand your trading arsenal in our FREE courses (for a limited time only) by clicking here
Go secure and build your wealth!
