
Bought a stock only to watch it drop for a week? Your heart sinks each time you check on the performance of your stock. You have done your due diligence (company’s earnings has been increasing and the stock chart is moving upwards) before you decided to buy. You are left perplexed.
Do not worry. Technical Analysis (TA) is the answer.
TA is able to determine the direction of stock prices with the probability in your favor, hence it works wonderfully in timing entries.
TA is a huge topic by itself which includes indicators and oscillators such as ADX, Bollinger Bands and MACD. I will focus on support and resistance (S/R) in this article.
#1 S/R Zones Are Significant
Support zones are like the ground where prices fall to and either stay there or bounce up. If prices always bounce at the $20 level, then $20 is a strong support level. At $20, buyers are snapping up this stock.
Resistance zones are like ceilings which act as a price obstacle. Prices usually bounce down from that zone. If prices always bounce down at the $50 level, then $50 is a strong resistance level where sellers step up in their selling of the stock.

Above: Chart of SPX as of 25 Oct 2019
Above is a chart from one of my weekly market updates. The sloping lines are known as trend lines. Trend lines are another form of S/R. Prices tend to either bounce off them or get obstructed by them.

Above: Chart of SPX as of Nov 2019
Look at the most recent 3020 area (circled). Prices moved into the zone and recently broke out and got stalled (previous resistance area became a support area) there before continuing upwards.
With S/R, you can better time your entry, identify good stop loss areas and profit targets. With this information, you will be able to calculate your risk to reward ratio (this is the ratio of the potential loss and gains).
#2 How Do You Know If This S/R Zone Is Significant?
There is a S/R zone when prices stall or rebound at that area twice or more.
Some charts have many S/R zones that are clustered near each other on the daily chart. For this case, I would look at the weekly chart and give more weight to the weekly S/R.
A good stock would meet these 2 criteria – fluency (no gapping up or down randomly) and respecting S/R zones. I would trade this stock when the opportunity presents itself.
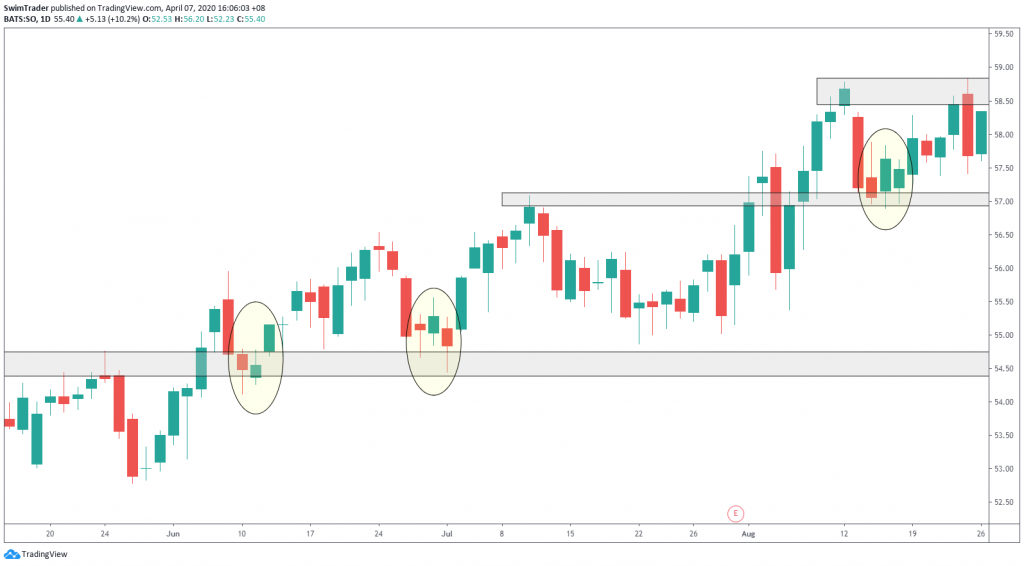
Above: Chart of SO
In the example of SO, previous resistance area became a support area (shown by the circles in yellow) and this pattern continues nicely. This tells me that prices respect the S/R zones. The prices also do not have large gaps up or down randomly which makes it a fluent chart.
This makes the stock prices more predictable compared to a stock that keeps gapping up or down irregularly. Personally I would like to trade such stocks.
Conclusion
In summary, draw horizontal S/R lines and trend lines, giving more weight to the weekly time frame. Prices must have contacted the lines and stalled at that area twice, at least.
Your heart will sink much less often.
Here’s What You Can Do To Improve Your Trading Right Now:
#1 Join us in our Facebook Group and share your questions as we learn and grow.
#2 Never miss another market update; get it delivered to you via Telegram.
#3 Grab a front row seat and discover how you can expand your trading arsenal in our FREE courses (for a limited time only).
See you around!
