
With the S&P 500 (US stock market) at an all-time high, is it a good time to buy? Are there signs of a reversal?
The Moving Average Convergence Divergence (MACD) indicator is helpful in predicting short-term turning points.
As the MACD indicator is derived from moving averages, you are strongly encouraged to read these 2 articles on moving averages: Part 1 and Part 2.
MACD Explained
What is it?

As mentioned above, the MACD indicator was based on the moving average indicator, more specifically the exponential moving average (EMA). It was created by Gerald Appel to provide vital information on price action.
You’ll spot the difference in responsiveness between a simple and exponential moving average in our Glossary.
The common parameters used in the MACD indicator are 12, 26, and 9.
What is it used for?
#1 Warn of a potential change in price momentum
#2 Time your entry and exit better
Let’s look at Arrow Electronics (ARW) throughout this article.
Geek Speak (skip this section if Math gets you dizzy)
How to get the MACD line?
Please refer to the calculation of EMA before you continue.

where the EMA values are derived from the prices of your stock.
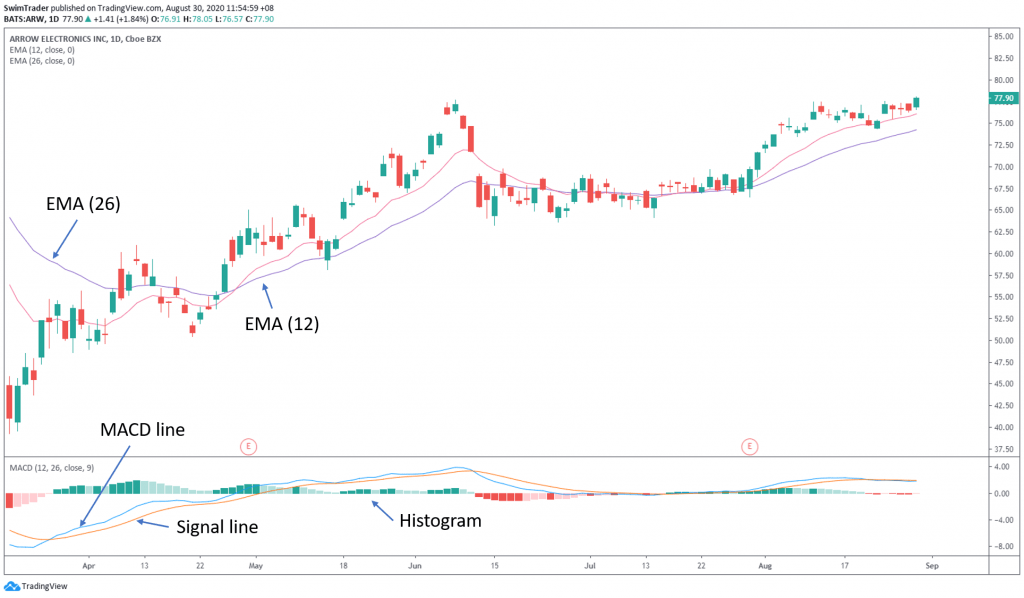
The EMA (26) is purple while the EMA (12) is in pink.
The MACD line is in blue and the Signal line is in orange.
When the MACD line is positive (greater than 0), it tells you that market participants value the stock more in the recent 12 days compared to the past 26 days.
MACD Histogram = MACD line – Signal line
The histogram is the difference between MACD line and signal line. When it is positive (greater than 0), it indicates bullish momentum. The reverse is true for bearish momentum.
4 Golden Keys To A High Probability Trade
#1 Trend Filter Signal
MACD tells you the direction of the price momentum.
When the MACD line rises above the signal line, the histogram turns green (marked out below). This is a heads up, telling you that the bulls are in charge. You may buy in a bullish market.
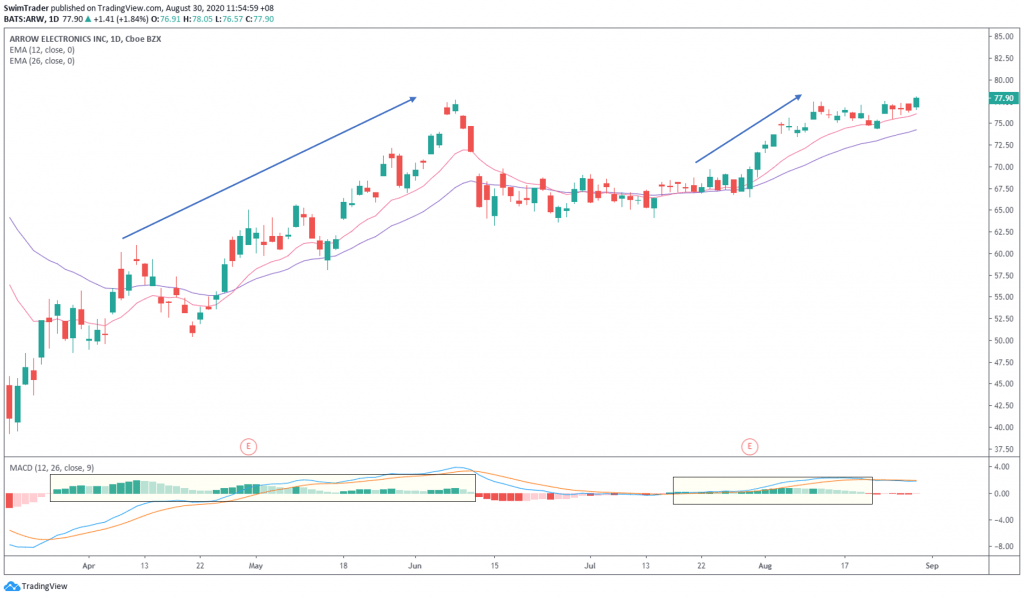
When the MACD line is below the signal line, the histogram turns red. It is a bearish signal and you may go Short. However, I don’t advice going Short in a bull market.
#2 Trend Filter Confirmation
After seeing green histogram bars appearing, check the EMAs. Wait for a bullish crossover between the EMA (12) and EMA (26). This crossover tells you that the momentum is bullish and going Long will bring you the money.
That’s also when the MACD line (in blue) will be in positive territory, confirming the trend.
Buy on the pullback to get in at a more favorable price or buy on the 2nd day after the crossover to minimize the chances of getting caught in ranging prices. The histogram MUST remain green. 
Be sure to size your trade well and place a good stop loss. Remember, capital preservation is essential to becoming a profitable trader.
#3 Price Consolidation Before Continuation
Combining the MACD indicator with chart patterns, you’ll be richly rewarded.
After moving for some time, prices will have to take a break. They start to consolidate and you’ll want to watch them closely for signs of a trend continuation.
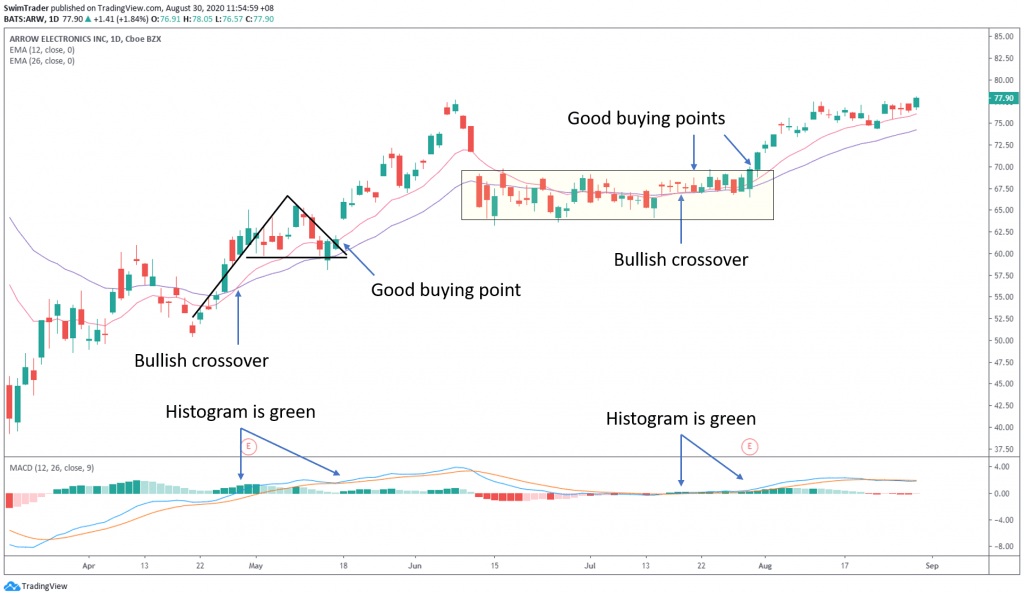
Can you name the 2 chart patterns that have been drawn out? Here’s a hint: The chart pattern on the left starts with P while the one on the right starts with R.
#4 Change In Momentum
As mentioned earlier, when the histogram is red, it warns of a lack of bullish momentum; the bears have crept out to take control. This may even happen when prices are rising, as what’s happening to ARW (since late Aug 2020).
When the histogram turns green, the bulls are back.
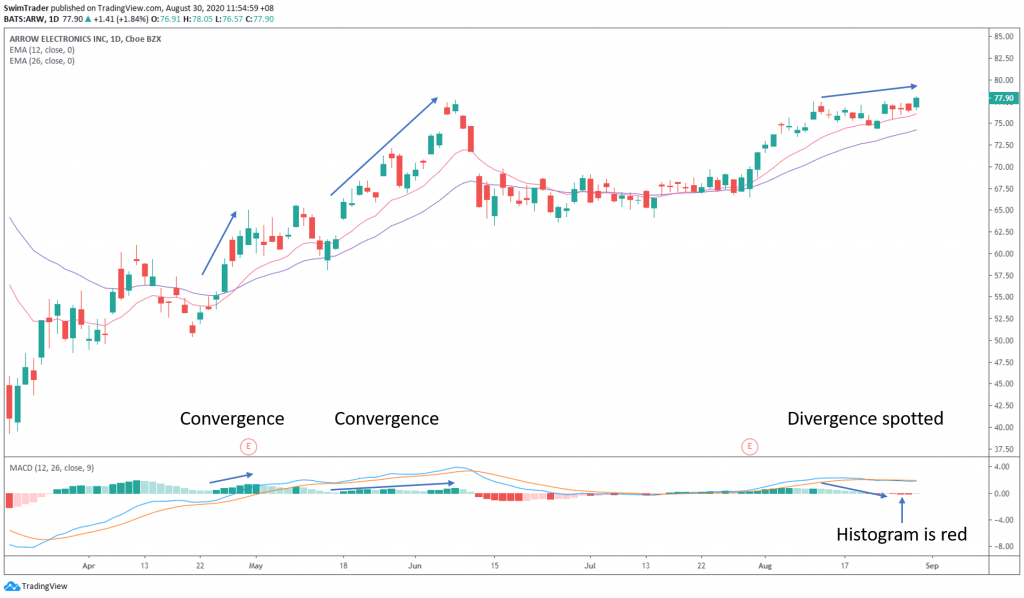
The bottomline? Wait for a convergence of the MACD histogram and the trend of ARW (as what happened in late Apr and mid May 2020) before going Long. Patience is a virtue.
Bonus
Fluency of any chart is important. You won’t want to trade an unpredictable stock which gaps up or down frequently as that would be a huge risk to trading capital.
In addition, watch out for the gap size as gaps tend to be an area of support and resistance.
4 Things You Must Remember About MACD

#1 MACD histogram predicts a possible reversal
#2 A trend is confirmed when the MACD line is in positive territory
#3 Increase your rate of success by combining chart patterns with the MACD indicator
#4 Be patient and wait for a convergence
Here’s What You Can Do To Improve Your Trading Right Now:
#1 Register for our market outlook webinars by clicking here
#2 Join us in our Facebook Group as we can discuss the various ways of applying this by clicking here
#3 Never miss another market update; get it delivered to you via Telegram by clicking here
#4 Grab a front row seat and discover how you can expand your trading arsenal in our FREE courses (for a limited time only) by clicking here
Trade safe!
