
Cristiano Ronaldo.
He is highly regarded as the world’s greatest of all time (GOAT) footballer. He is the kind of player that you’d not see again for many years, even decades. Fans surround him for photos and autographs.
Just as you’d request to take a photo with Ronaldo, you’d want to buy stocks which show these 7 rare but powerful bullish reversal candlestick patterns which will be covered.
Please note the common misconception of bullish reversal candlestick patterns. Read all about it in Part 1 before coming back so that you know what to expect.
More bullish reversal candlestick patterns can also be found in Part 1 and Part 2.
Let’s dive right in to the 7 rare but powerful bullish reversal candlestick patterns!
#1 Morning Star
The 5 characteristics of the Morning Star candlestick pattern and its significance are listed in the table below.
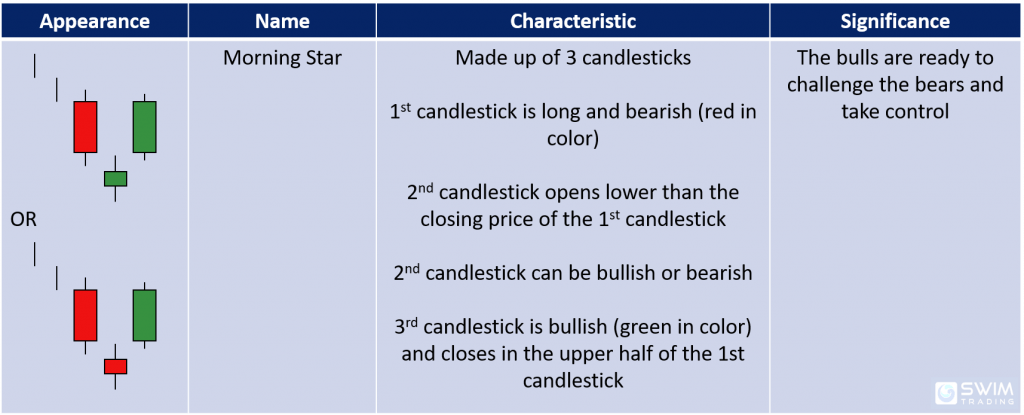
The 3 vertical lines before the Morning Star pattern represent the range of the previous candles. The previous candles’ color, shape and size are not important. The most important thing is that they are trending down.
Note that the 2nd candlestick must gap down (ie open below the closing price of the 1st candlestick).
Trading Psychology
Let’s see how the Morning Star pattern played on the chart of FB in early Oct 2019.

The 1st candlestick must be bearish (red in color).
This is followed by a gap down, indicating that the bears are firmly in control. But they didn’t win easily on the 2nd candlestick. There was a tough fight between the bulls and bears which are shown by the upper and lower shadows. The bulls had pushed prices to cover the gap, but the bulls managed to end off with a marginal victory, resulting in a tiny red candlestick body.
On the 3rd day, the bulls were back attempting to push prices up. They succeeded in overcoming the bears, forming the Morning Star bullish reversal candlestick pattern.
As with all bullish reversal candlestick patterns, volume plays a critical role for success. A high volume is a strong confirmation that prices are set to rise.
Prices rose $11.60 (6.4%) in a short 2 weeks and continued to rise further thereafter.
#2 Bullish Abandoned Baby
Let’s discover the 7 characteristics of the Bullish Abandoned Baby candlestick pattern from the table below.
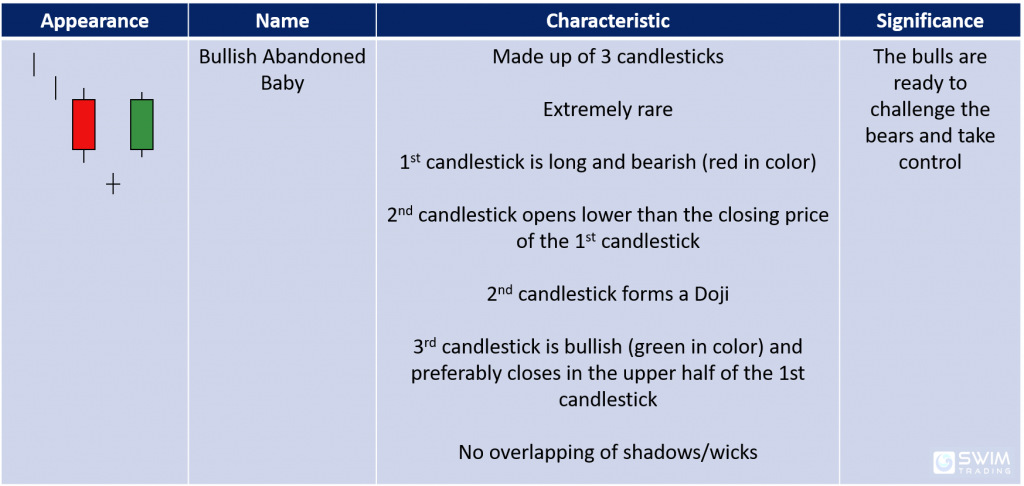
The 2 vertical lines before the Bullish Abandoned Baby pattern represent the range of the previous candles. The previous candles’ color, shape and size are not important. The most important thing is that they are trending down.
This is one extremely rare bullish reversal candlestick pattern.
Let’s see when it last appeared on SPX and learn about the psychology behind this bullish reversal candlestick pattern in the next section.
Trading Psychology
This candlestick pattern last appeared on SPX in late Nov 2018.
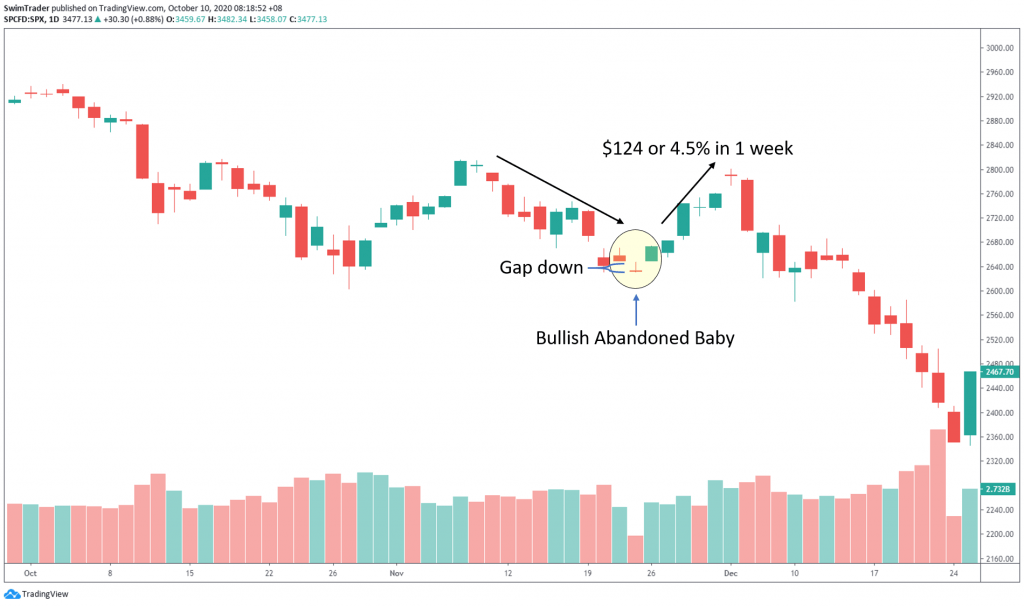
SPX was trending lower before the Bullish Abandoned Baby candlestick pattern showed up.
The bears were strong and drove prices down. They were so strong that the 2nd candlestick opened lower than the closing price of the 1st. The bulls had tried to gain control, but lost out eventually.
During the next session, the bulls tried to regain control, which they did succeed! The bulls were so strong that there’s a gap up and a Marubozu was formed. Prices continued to soar in the coming week, increasing by $124 (4.5%) in a week!
It is good to note the volume as high volume is a strong confirmation that the bulls are back.
#3 Bullish Tri-star
This is another rare bullish reversal candlestick pattern. Let’s have a look at its characteristics.
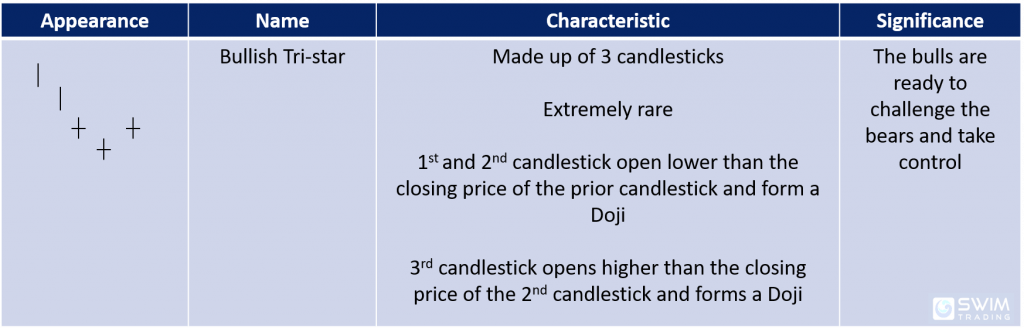
Prices are trending down and suddenly, 3 Dojis are formed. There is a gap between each of them.
Trading Psychology
This rare bullish reversal candlestick pattern can be found on the chart of BBBY in late Apr 2020.

BBBY was trending down until the Bullish Tri-star candlestick pattern appeared. Though not exactly Dojis, the trading psychology is the same as the opening and closing prices of each candlesticks are very close to each other.
Dojis send out a powerful message to traders. Dojis tell you that the bulls and bears had a fight which neither of them won convincingly. It is a sign on indecision and disinterest.
Here, volume should be low.
As prices climb, volume should increase.
After the Bullish Tri-star candlestick pattern showed up, prices flew by 62% ($2.95) in just 1 week!
#4 Three Inside Up
What are the 6 characteristics of the Three Inside Up bullish reversal candlestick pattern?
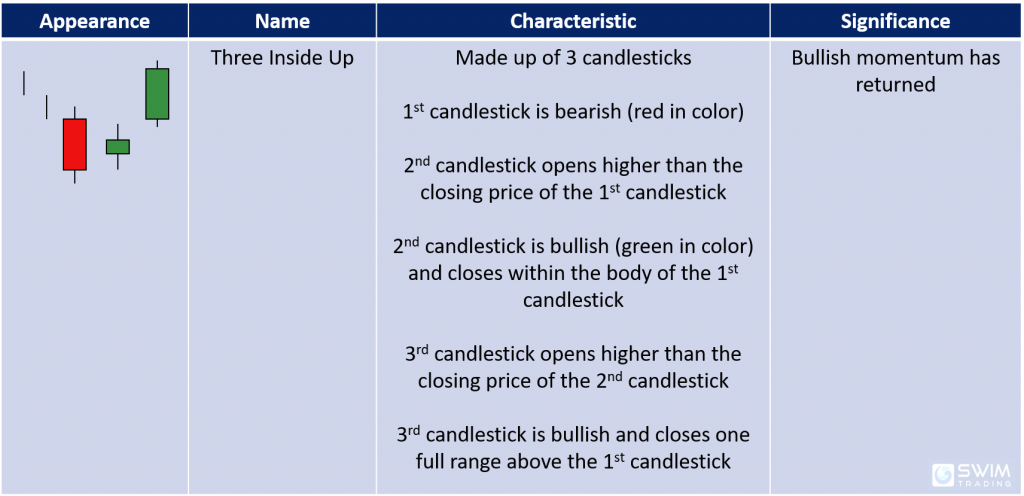
As the rest of the bullish reversal candlestick patterns, the 2 vertical lines before the Three Inside Up pattern represent the range of the previous candles. The previous candles’ color, shape and size are not important. The most important thing is that they are trending down.
Note the gap up on the 2nd and 3rd candlesticks. They are strong signs of a bullish reversal.
Trading Psychology
You’ll find the Three Inside Up candlestick pattern on the chart of IBUY in early Feb 2020.
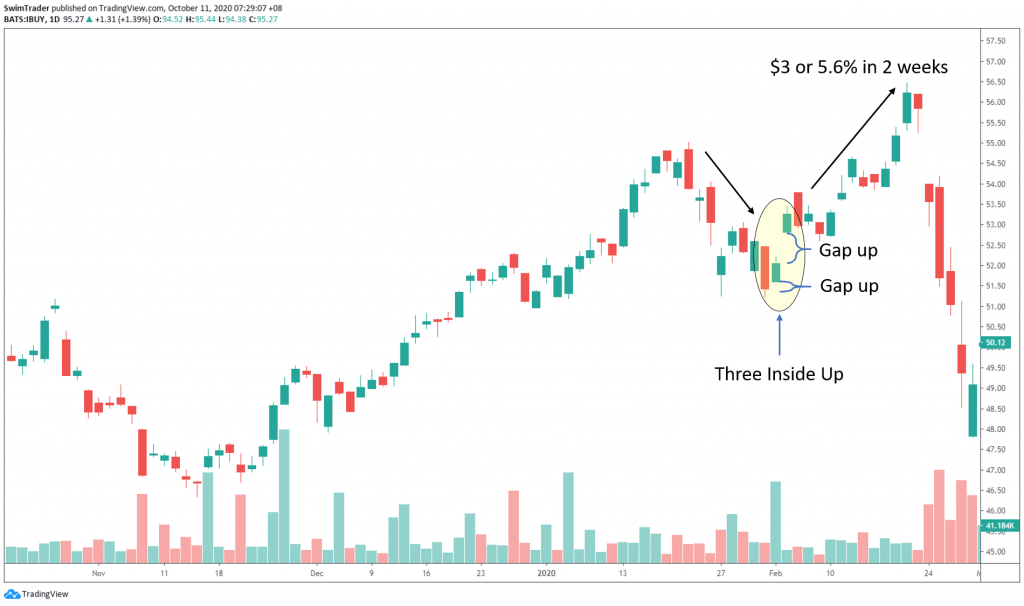
The Three Inside Up candlestick pattern shows up as prices were declining.
The bears were out in full force, resulting the 1st candlestick to be long and in red.
Prices gapped up on the opening of the 2nd candlestick and stayed above its opening price. The bulls have been woken.
The bullish momentum continues on the 3rd candlestick where there’s another gap up. The bulls continued to be in charge for another 2 weeks, pushing prices up by $3 (5.6%) in 2 short weeks.
You’ll want to see high volume.
#5 Three Outside Up
The Three Outside Up bullish reversal candlestick pattern has the following 7 characteristics as shown in the table below.
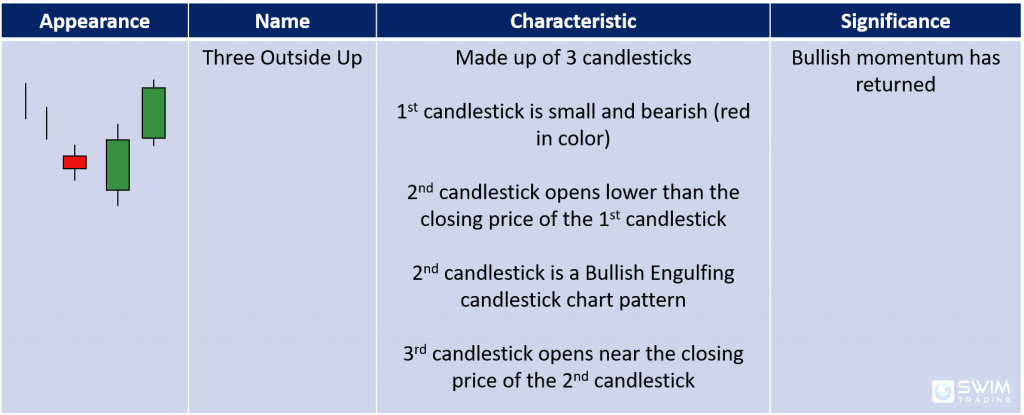
Again, the 2 vertical lines before the Three Outside Up pattern represent the range of the previous candles. The previous candles’ color, shape and size are not important. The most important thing is that they are trending down.
Gaps also play a significant role in this candlestick pattern.
Let’s uncover the psychology behind this candlestick pattern in the next section.
Trading Psychology
This chart pattern just appeared on the chart of SQ.
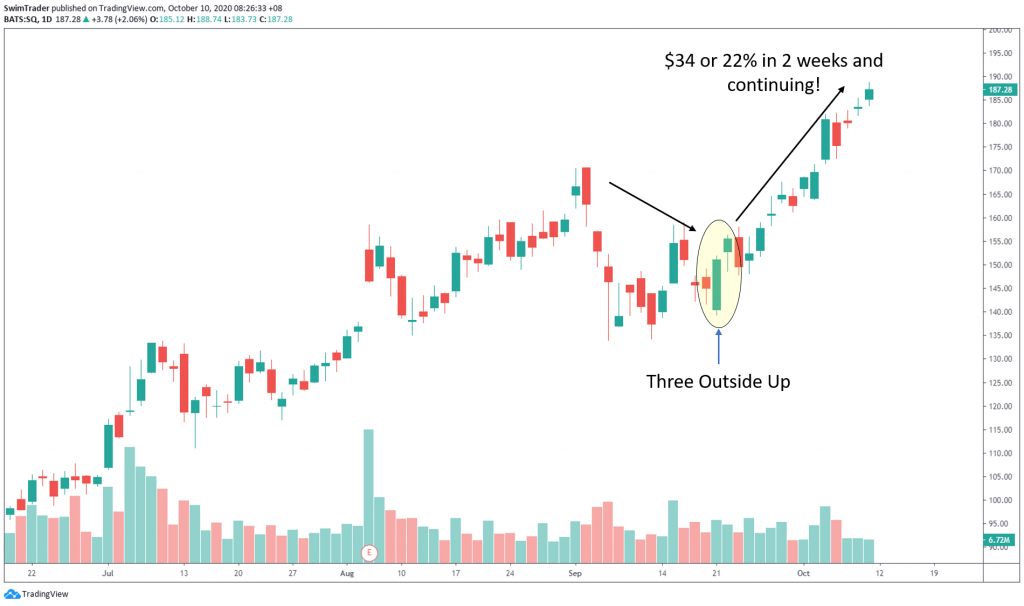
Do you see a Bullish Engulfing candlestick pattern within the Three Outside Up pattern?
What was happening while the Bullish Engulfing pattern was formed? Find out in Point 3 of this article.
The 3rd candlestick gapped up at the open. This sends a strong signal that the bulls are well in charge. But they were challenged by the bears. The bears stepped in to push prices down, forming the lower shadow. However, the bulls won at the end of the day.
After resting for 2 days, the bulls returned stronger, causing prices to surge $34 (22%) in 2 weeks. And the uptrend is continuing!
Remember to watch for high volume for a stronger conviction that this bullish reversal candlestick pattern will work as planned.
#6 Bullish Breakaway
The Bullish Breakaway has a long list of characteristics. You may want to save this table and refer to it.
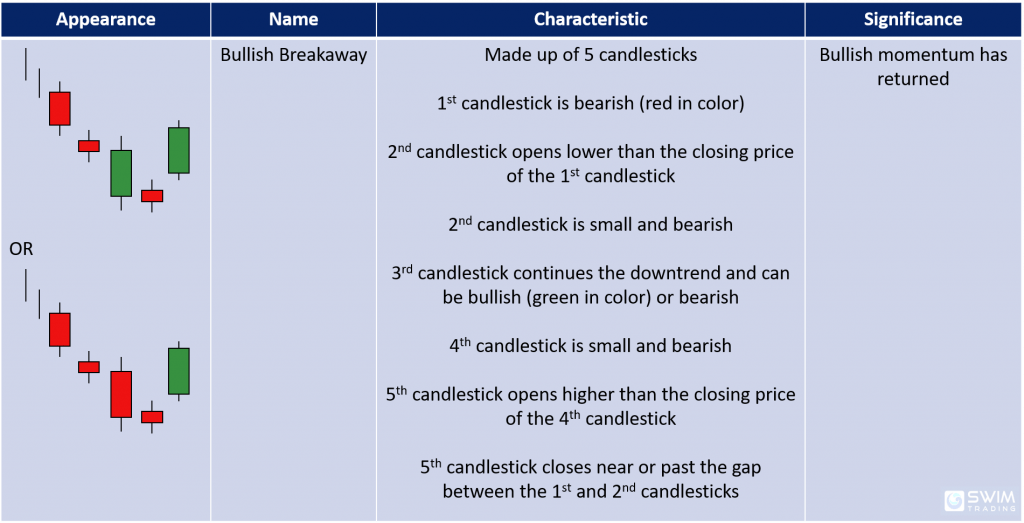
It is important to note the size of each candlesticks.
Trading Psychology
The Bullish Breakaway bullish reversal candlestick pattern appeared on the chart of DAL in mid-Dec 2019. Let’s uncover what happened in the formation of this candlestick pattern.

Things are rather bleak when there are 3 or more consecutive bearish candlesticks. To have 4 bearish candlesticks in a row is ultra bearish!
But just as you’d thought that the price of DAL was to continue sliding, a gap up on the 5th candlestick appeared.
The 5th candlestick was bullish and wiped out all the remaining bears. This meant that the momentum was with the bulls and they are all ready to push prices higher.
This took place, and prices were pushed higher by $2.90 (5%) in a short week!
Uninformed traders who shorted DAL would be in a state of shock. They hadn’t seen this bullish reversal coming.
As prices increase, volume should increase as well.
#7 Bullish Rickshawman
This is another bullish reversal candlestick pattern where one of its candlestick can either be green or red in color.
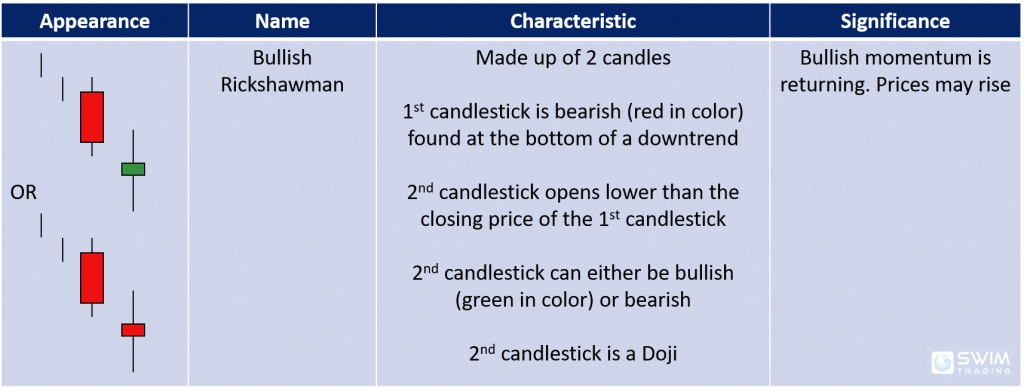
Similar to all the other bullish reversal candlestick patterns, the 2 vertical lines represent a downtrend. The color and size of don’t matter.
This candlestick pattern was spotted on the chart of JD in early Aug 2020.
Trading Psychology
What was the psychology of the traders?
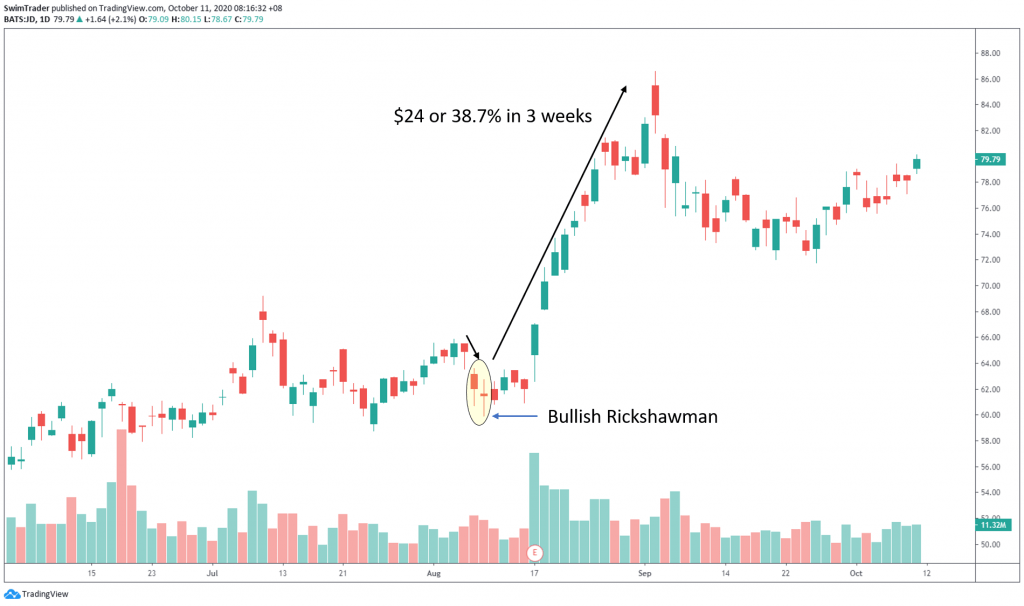
Traders were pessimistic. That sent prices lower.
In fact, they were so pessimistic that there was a gap down on the 1st and 2nd candlesticks.
However, that pessimism turned into optimism as the 2nd candlestick ended in a Doji. Its closing price and opening price was pretty much the same.
As optimism grew, prices started to rise bit by bit until it soared by $24 (38.7%)!
A key indicator to watch is volume. The huge increase in volume on 17 Aug 2020 led to a dramatic rise in price. Prices took off like a rocket.
7 Candlesticks Patterns You Have Mastered Today
That’s a lot of bullish reversal candlestick patterns for today! Here’s a recap of their names:
#1 Morning Star
#2 Bullish Abandoned Baby
#3 Bullish Tri-star
#4 Three Inside Up
#5 Three Outside Up
#6 Bullish Breakaway
#7 Bullish Rickshawman
You’ve learnt a total of 17 bullish reversal candlestick patterns. Which have you spotted lately?
In our next article, we will be looking at another handful of lesser known bullish reversal candlestick patterns. So come back and be rewarded.
Here’s What You Can Do To Improve Your Trading Right Now:
#1 Register for our market outlook webinars by clicking here
#2 Join us in our Facebook Group as we can discuss the various ways of applying this by clicking here
#3 Never miss another market update; get it delivered to you via Telegram by clicking here
#4 Grab a front row seat and discover how you can expand your trading arsenal in our FREE courses (for a limited time only) by clicking here
Trade safe!
