
Losing money isn’t an option because you don’t have a large trading capital. So you’ll need to time your entry and exit well. This is also applicable to you if your appetite for risk is small.
Not losing money is also the motto of Warren Buffett. He famously mentioned, “Rule No. 1: Never lose money. Rule No. 2: Never forget rule No.1.”
How can you time your entry and exit better? The Bollinger Bands indicator works beautifully.
Bollinger Bands Explained
What is it?
Bollinger bands are created by John Bollinger in the 1980s.
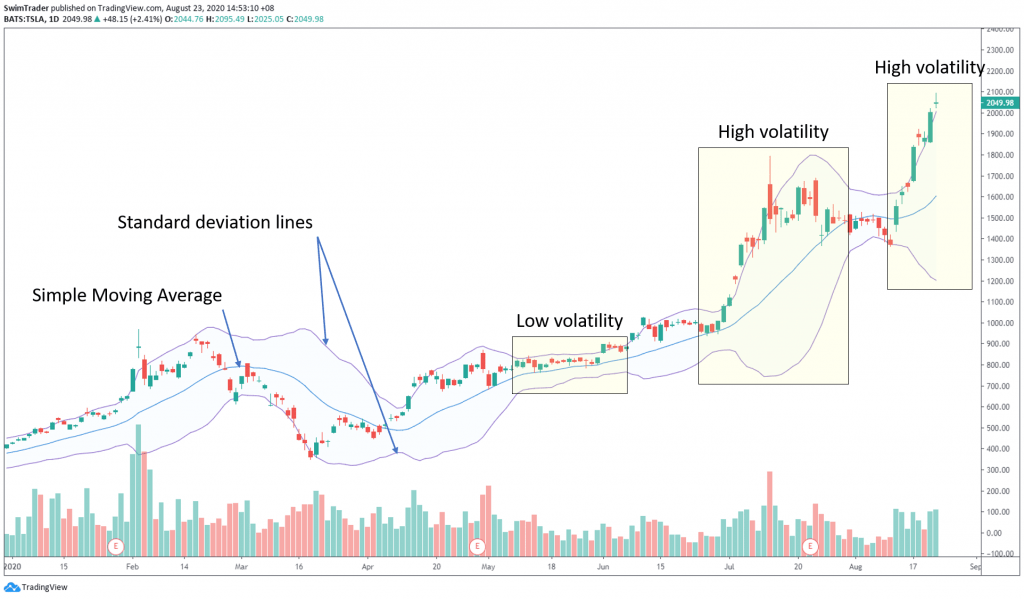
The Bollinger bands are formed using the simple moving average (SMA) and standard deviation (SD), measuring volatility. Standard deviation is a calculation of the distance price deviates from the SMA at any point of time.
Here are 2 recent articles on Moving Averages: Part 1, Part 2.
The most common parameters used are the 20-period SMA, and 2x standard deviation from the upper band to the SMA and from the lower band to the SMA.
There are a total of 3 lines in the Bollinger bands – 1 SMA and 2 SD lines. The SMA is in the middle of the 2 SD lines as shown in the chart below.
You’ve guessed it. The wider the Bollinger bands are from each other, the higher the volatility.
Many have been asking about Tesla (TSLA), so I’ll do a case study on it using the Bollinger Bands.
Geek Speak (skip this section if Math gets you dizzy)
Calculating the Bollinger Bands
As mentioned, the bands are 2x standard deviation away from the SMA. This is adjustable to suit your preference. If you are a longer term trader, you may use a 3x or even 4x standard deviation width.
Here’s a table using the SPY (ETF of SPX) as an example:
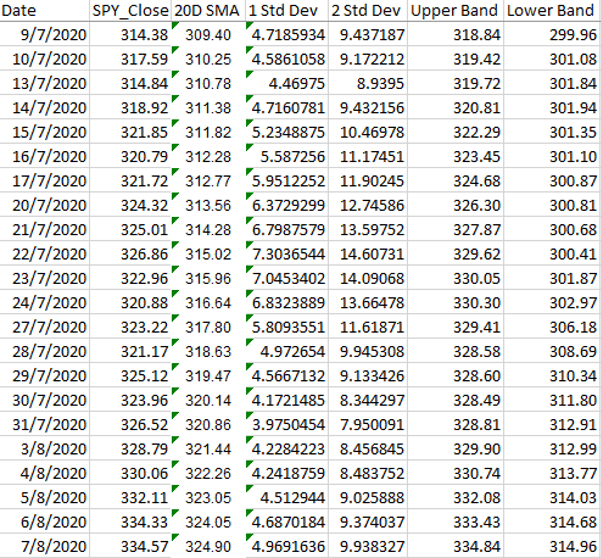
Now that you understand how Bollinger bands are calculated, you are ready to watch it in action!
4 Secrets Of Bollinger Bands You Were Not Told
#1 Time your entry
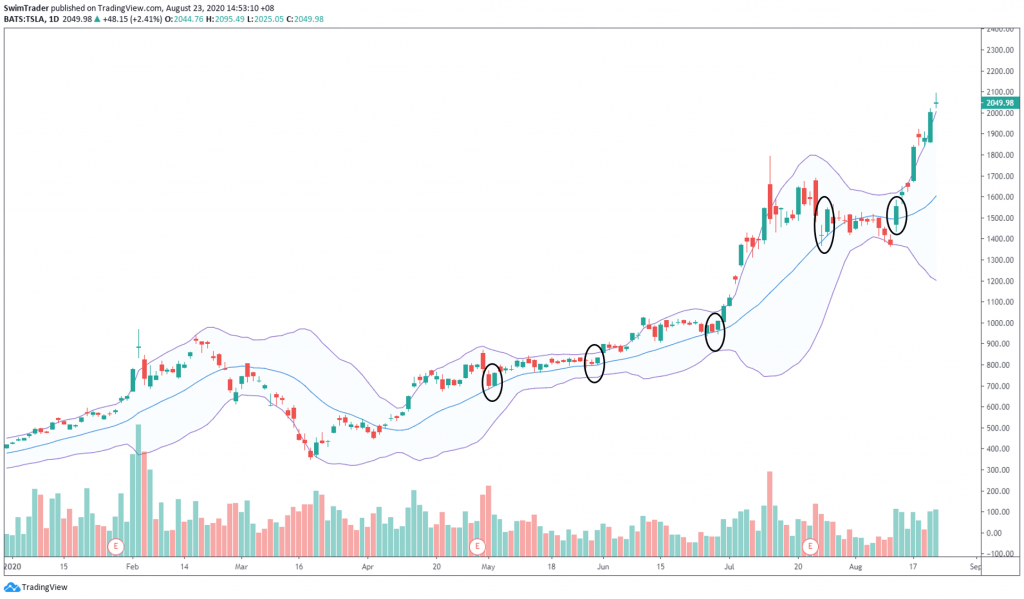
No price will go up or down forever; price will eventually retrace.
When price retraces to the middle band (SMA), it presents you with the opportunity to enter a position.
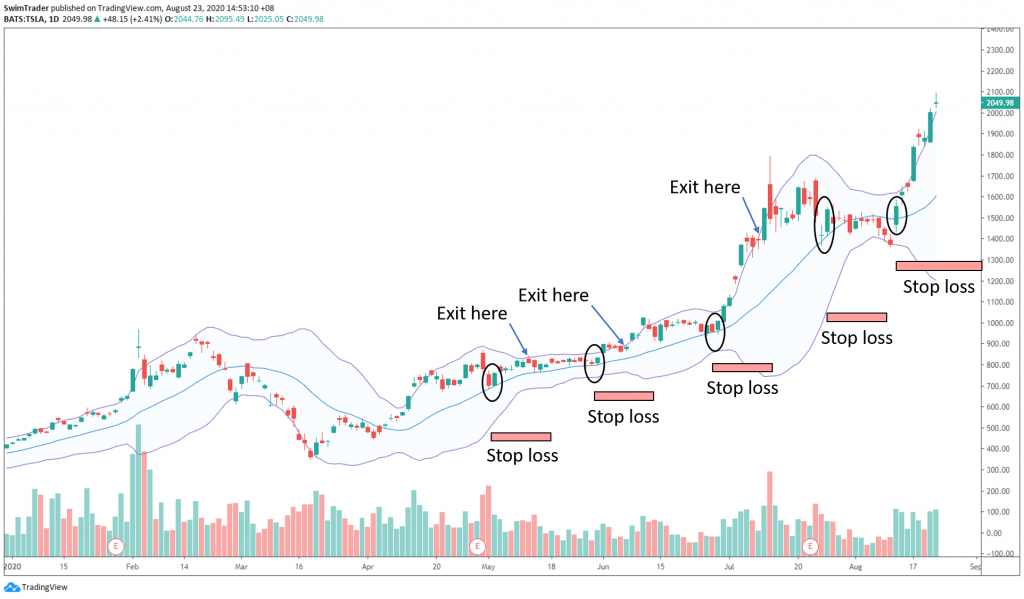
The chart below has the retracements circled out. There were 4 wonderful opportunities to go Long on Tesla since May 2020.
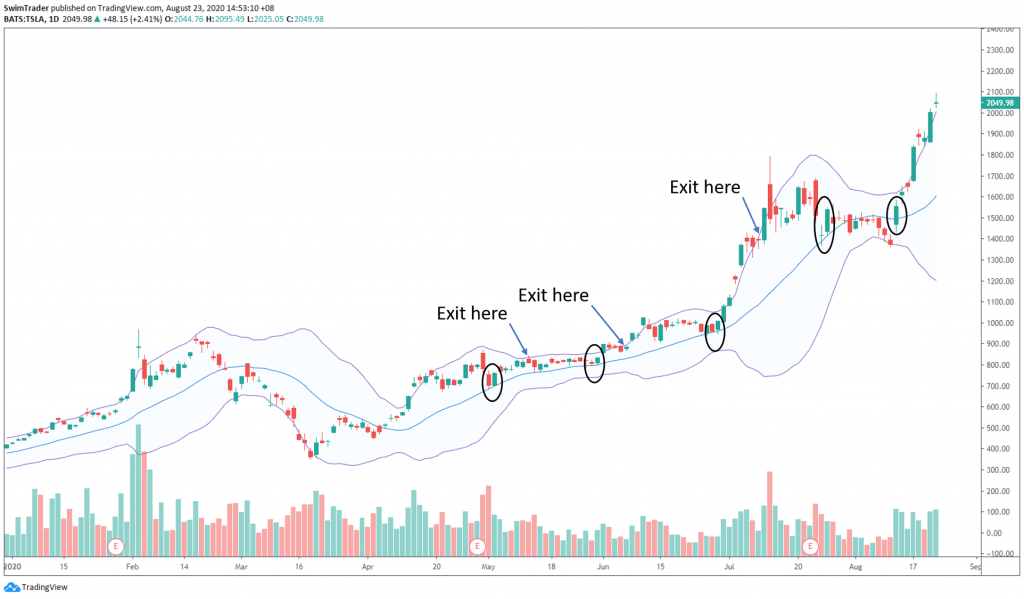
#2 Time your exit
Before entering a trade, it is important to have an an exit plan.
With the Bollinger band indicator, you’ll have to determine which of the 2 exit strategies you’d like to employ:
#1 Price hits the upper/lower band (for Long/Short positions respectively)
#2 Price comes back into the upper/lower band (for Long/Short positions respectively)
Set your price target and work out your stop loss level that’s explained in the next section.
#3 Setting a good stop loss level based on volatility
Since Bollinger bands also tell you about the volatility of the stock, you can utilize it to place a good stop loss level. A good stop loss level takes volatility into account to prevent you from getting stopped out prematurely. You’ll be banging your head if the stock rises after stopping you out too soon.
Be sure to size your trade right to protect yourself and stay in this business for a long time. You can use our position sizing calculator instead of crunching out the numbers manually.
#4 The Secret To Maximizing Your Profits
This is a well-kept secret.
Some traders encourage their followers to enter a position when price touches the upper/lower band (for Long and Short positions respectively) because this indicates that the stock is very strong.
Unfortunately, that’s only a part of the story.
Trend followers make money by riding trends and cutting losses quickly. Hence, it is better to combine the Bollinger bands indicator with price movement.
The circled areas in the chart below show prices touching the upper band and continuing its upward movement.
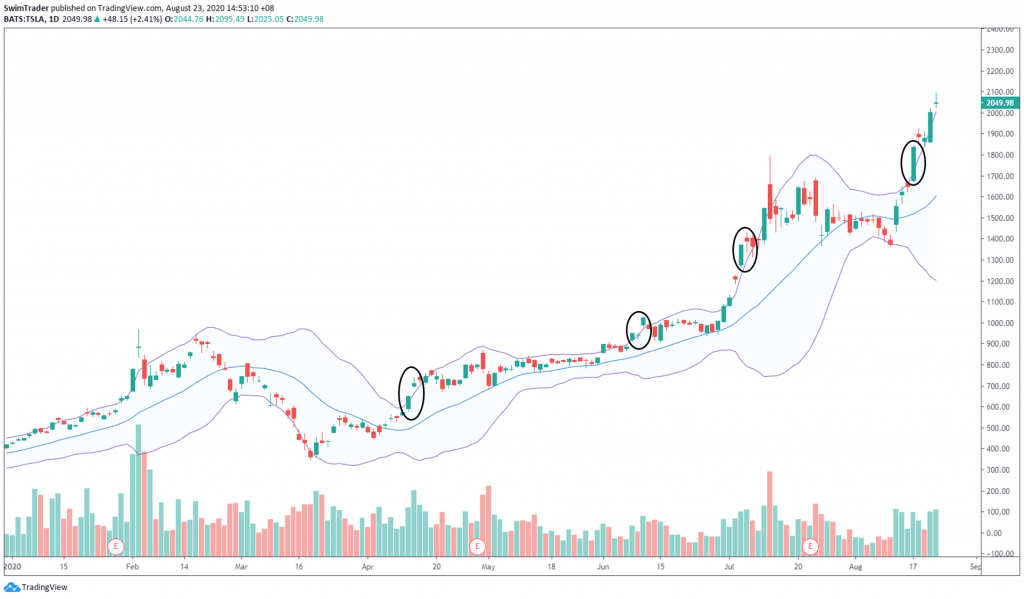
Do this ONLY if the stock is extremely strong and that you are comfortable with a very wide stop loss level.
4 Things You Must Remember About The Bollinger Bands Indicator
Bollinger bands are useful for:
#1 Timing your entry for an edge
#2 Timing your exit to take profit
#3 Setting your stop loss level right for the trade to play out
#4 Taking advantage of very strong stocks
Here’s What You Can Do To Improve Your Trading Right Now:
#1 Register for our market outlook webinars by clicking here
#2 Join us in our Facebook Group as we can discuss the various ways of applying this by clicking here
#3 Never miss another market update; get it delivered to you via Telegram by clicking here
#4 Grab a front row seat and discover how you can expand your trading arsenal in our FREE courses (for a limited time only) by clicking here
Trade safe!
