
You have drawn your trendlines, support and resistance zones. You have scanned for the common chart patterns and none of them are present. You think that there is no opportunity and are about to move on to the next chart.
Hold on. Chances are, you have not considered this chart pattern. You are not the only one as this chart pattern is often overlooked – the broadening formation chart pattern.
What’s The Cause Of A Broadening Formation Pattern?
Market participants are split in their evaluation of the stock. This results in heightened volatility, causing prices to range greatly in this chart pattern before the bulls or bears take full control.
Spot It Right
While most chart patterns display converging prices, this displays diverging prices as shown in the examples below.
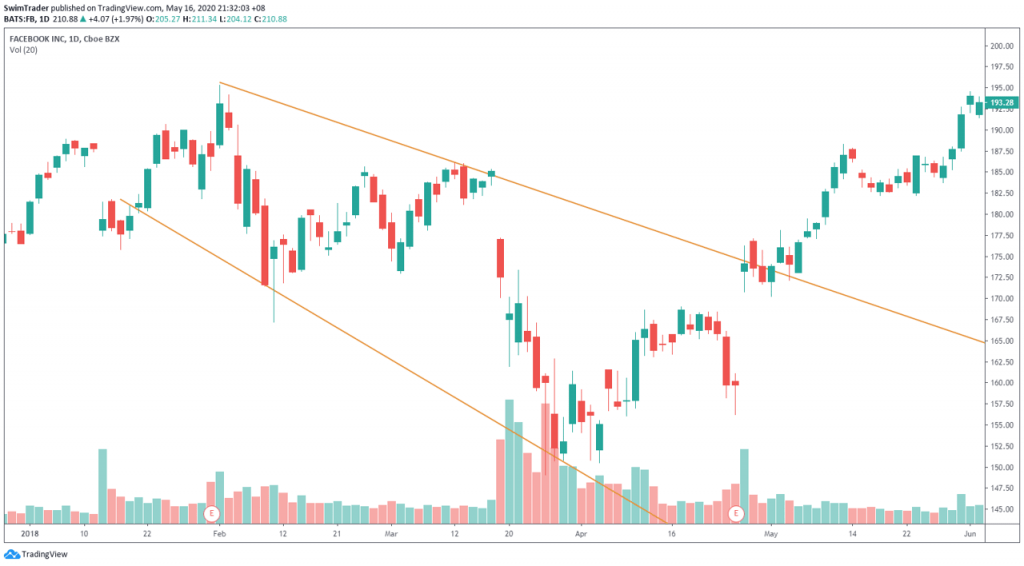
#1 Bullish Broadening Formations:
Characteristics:
- High volatility
- Diverging trendlines
- Decent volume on breakout important (to justify accumulation)

#2 Bearish Broadening Formation:
Characteristics:
- High volatility
- Diverging trendlines
- High volume at the market tops


Show Me The Money
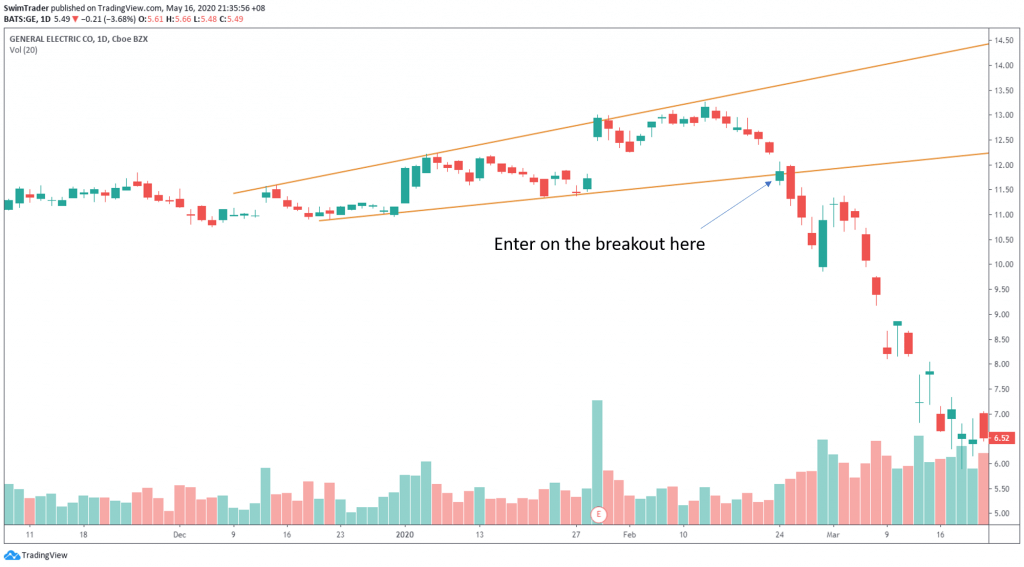
#1 Breakout Trade
- Watch for price to break the broadening formation line
- Enter your position according to the direction of the breakout the next session
- If you are trading using the hourly chart, enter the trade an hour later
- If you are trading according to a daily chart, enter the trade on the next day

#2 Pullback Trade
- Watch for price to break the broadening formation line
- Wait for the price to pull back to the area near the line and enter your position the next session
- If you are trading using the hourly chart, enter the trade an hour later
- If you are trading according to a daily chart, enter the trade on the next day


Conclusion
Broadening formations exist in times of high volatility. Many traders fear volatility and see it as a negative because they are under equipped. You are different as you know how to emerge successful by adding this chart pattern into your trading arsenal.
Here’s What You Can Do To Improve Your Trading Right Now:
#1 Register for our market outlook webinars by clicking here
#2 Join us in our Facebook Group as we can discuss the various ways of applying this by clicking here
#3 Never miss another market update; get it delivered to you via Telegram by clicking here
#4 Grab a front row seat and discover how you can expand your trading arsenal in our FREE courses (for a limited time only) by clicking here
Trade safe!
