
Happy New Year!
In the last 2 months of 2020, you’ve been introduced to swing trading. You’ve learnt about the following:
- What swing trading is
- Which broker to conduct your trades with
- A good amount to begin trading
- Requirements of a good charting platform
- The importance of interpreting candlesticks
- Trendlines and areas of confluence
As you’ve seen in Swing Trading – What Is It, prices move in waves. This means that prices will have to stop rising or falling for a while. Understanding this is crucial to help you remain calm instead of chasing prices.
Drawing trendlines can help you identify possible turning points, support and resistance areas, and the speed of the trend. In last week’s article on trendlines, the price of HUBS was at the top most trendline. Prices have come down since.

Oh, do you see an area of confluence around $400?
With the fundamentals settled, you are ready to dive into the most exciting part – strategies! They are the Flag and Wedge chart patterns.
I’ll be using the chart of PAGS throughout.
#1 Flag
Here’s how a flag chart pattern looks like.

There are 2 parts to a flag chart pattern which you need to know – pole and flag.
The pole is where prices ascend. The stronger the ascend; the steeper the pole, the better.
The 2nd part of the flag pattern is the flag. This is where prices consolidate or decline a little (aka pullback).
Would you like to see high or low volume in a consolidation or temporary decline? The answer is low volume. Why?
Low volume in a consolidation or pullback in an uptrend signifies that traders and investors are digesting the stock. In other words, investors and traders are getting to terms with this new price and are shunning this stock for the time being.
High volume must be seen throughout the formation of the pole. This suggests that the financial institutions are interested in this stock, buying more of it. How does this look like on the chart?

The 1st flag pattern is ideal because of a steep pole, high volume while the pole was forming, and low volume as the flag was forming.
The 2nd flag pattern is less ideal as its pole isn’t steep, there’s decreasing and low volume as the pole was forming, and high volume during the formation of the flag.
Does this mean that you shouldn’t buy PAGS at the 2nd flag pole? You could still buy at the breakout, but with a smaller position size as the conditions weren’t ideal.
#2 Wedge
This is another chart pattern that excites swing traders.
The wedge chart pattern looks similar to the flag chart pattern. The concept is the same where there is an ascent of prices which is followed by a consolidation or pullback.
The 2 parts to a wedge chart pattern are the pole and wedge.
The pole is where prices ascend. The stronger the ascend; the steeper the pole, the better.
The wedge is the part where prices consolidate.
Here’s how the wedge chart pattern looks like.

Here, you’ll also want to see high volume throughout the formation of the pole, and low volume as the wedge forms.
Let’s add in the volume indicator!
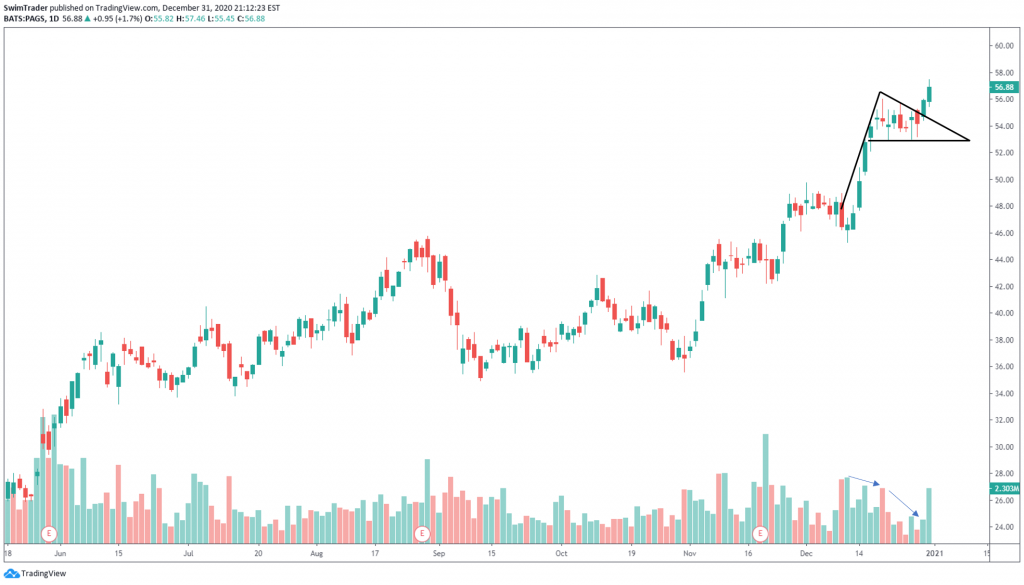 Though volume was decreasing as the pole was formed, the level of volume was high. Volume was low as the wedge was formed. This is an ideal wedge chart pattern.
Bonus Tip
Remember confluence? It was discussed in my previous article.
Add in your short-term trendlines and support and resistance zones.

There is a strong area of confluence at the breakout of the wedge. Adding in your trendlines and support and resistance zones to identify for areas of confluence will greatly increase your chances of success.
Here’s What You’ve Learnt Today
You’ve learnt 2 swing trading strategies that are easy to apply. You don’t need any sophisticated tools.
You’ve also learnt how to read volume and identify ideal flag and wedge chart patterns.
By combining volume, support and resistance, and trendlines, you have an edge over other traders.
Here’s What You Can Do To Improve Your Trading Right Now:
#1 Register for our market outlook webinars by clicking here
#2 Join us in our Facebook Group as we can discuss the various ways of applying this by clicking here
#3 Never miss another market update; get it delivered to you via Telegram by clicking here
#4 Grab a front row seat and discover how you can expand your trading arsenal in our FREE courses (for a limited time only) by clicking here
Trade safe!
