
Happy New Year!
How’s your start to 2022?
It’s been a wet and cooling start here in Singapore due to the rain. And because of the cool weather, I’ve been resting more too.
I hope that you are enjoying a great start to 2022. Let’s resume our stock trading journey by having a look at an insurance company called Marsh & McLennan (MMC).
Big Picture
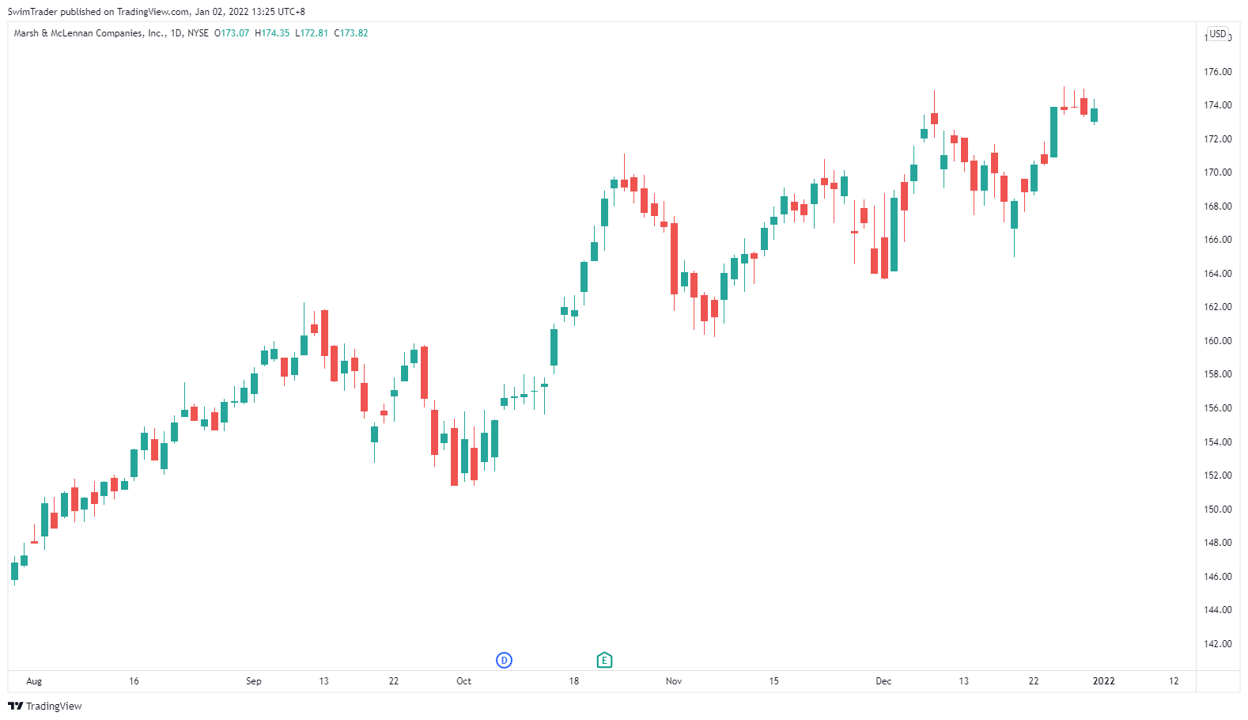
Like many other stocks, the last part of year 2021 was more volatile. Despite increased volatility, MMC ended the year well with a new all-time high created on 28 Dec 21!
Are there trading opportunities for MMC?
To answer this question, let’s have a look at its key price levels in the section below.
Key Price Levels

Why should you plot support and resistance levels?
Support and resistance levels are psychological price zones where market participants are ready to buy or sell. Because of this, support and resistance levels are key price levels that you’ll want to pay attention to.
Here, you can see an immediate resistance level at $175, an immediate support level at $170, and another support level at $161.
With this knowledge, can you tell that prices of MMC has just been rejected at the $175 price level? Market participants deem $175 as a good price to sell.
In Oct and Nov 21, $170 was deemed to be a great price to sell MMC, causing $170 to be the resistance back then.
Which price level should you focus on then? Let’s view the internals of MMC to draw a conclusion.
Technically Speaking

Adding 3 momentum indicators, the price of MMC looks to be overstretched. The value of the indicator at the top is near its overbought region while the values of the other 2 indicators are in their overbought region.
This suggests that there’s a high chance for the price of MMC to pullback in the coming week.
Given that you’ve identified the key price levels of MMC earlier, where do you think the price of MMC is likely to pull back to?
As with all plans, it’s ideal to have contingency plans. Let’s think of 3 scenarios which could possibly happen in the next few days.
- MMC pulls back to its immediate support zone at $170 and bounces to its immediate resistance level at $175
- MMC drops to its immediate support zone at $170 and lingers around $170 before heading up
- MMC falls below its immediate support zone at $170 to its next support zone at $161
Which of these 3 scenarios do you think is more probable?

Before you get too excited and rush to buy MMC, please remember to place a stop loss.
As much as prices can rise, prices can also drop. A stop loss level will help you to save your trading capital for another trade.
How can you identify a great place to place your stop loss at to prevent getting stopped out prematurely? This article will guide you.
You can also make 2022 your best year yet by discovering these 3 super stocks.
Conclusion
MMC is a strong stock which is on a great uptrend.
As with every rally, there’ll be pull backs. MMC is no exception. Therefore, I think that Scenario 1 has a high chance of happening in the coming days.
However, you’ll need to know that I’m not a financial advisor, so please treat this article as education. Have fun conducting your research and I’d love to hear your thoughts in our Facebook Group.
Here’s What You Can Do To Improve Your Trading Right Now:
#1 Join us in our Facebook Group as we can discuss the various ways of applying this by clicking here
#2 Never miss another market update; get it delivered to you via Telegram by clicking here
#3 Grab a front row seat and discover how you can expand your trading arsenal in our FREE courses (for a limited time only) by clicking here
Trade safe!
