
Investing is easy! All you have to do is buy the dips in a bull market and wait out.
What is a dip? A dip is when the market pulls back or corrects before heading higher.
But can prices continue to dip after a dip?

The start of Sep 21 wasn’t kind to investors and traders alike. The US stock market bled and lost more than 5.5% in the 1st 3 weeks of Sep 21.
A recovery followed to erase 3.2% of the decline. Is the dip/market correction over? Is it safe to buy the S&P 500 (SPY) now?
To answer those questions, let’s uncover the 3 things you need to look out for to profit from the dip.
#1 Reading Candlesticks
If you’re investing using the line charts, you may want to switch to using candlestick charts. Candlesticks are much richer in details. You can infer the market psychology, identify trends, and read the strength of a trend.
You may have heard that the stock market is irrational. And this is true for most of the time. This is because humans are involved. This brings a wide range of opinions and emotions to the stock market. Therefore, we need candlesticks to help us infer and read the pulse of the stock market.
Here’s a guide on how candlesticks are interpreted.
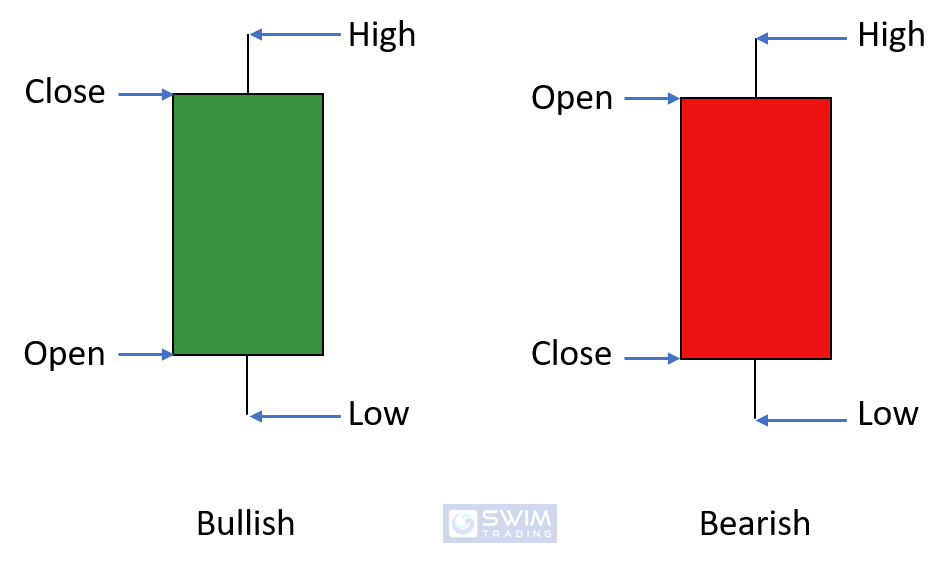
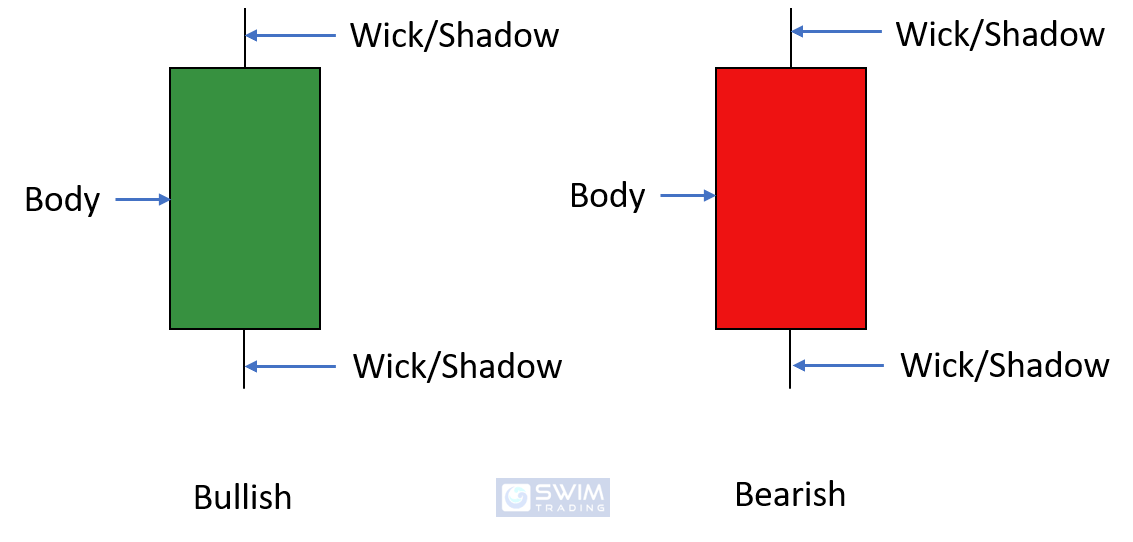
How can you use this to infer the market psychology? Learn all about it and discover how candlesticks charting is the backbone of trading and investing in this article.
#2 Characteristic Of The Stock Market
I have a young daughter and I’ve become familiar with her character and personality. She’s outgoing and enjoys singing. She has a tooth for sweet desserts, so I’ll use desserts as a reward for her good behavior.

To be successful in almost anything, it’s important to know the characteristic and personality of the subject and people involved. In this case, understanding the characteristic of the stock market will be beneficial.
Did you know that the stock market tends to be less bullish in Jan, Jun, Aug, and Oct? This can be seen from the bar chart below.
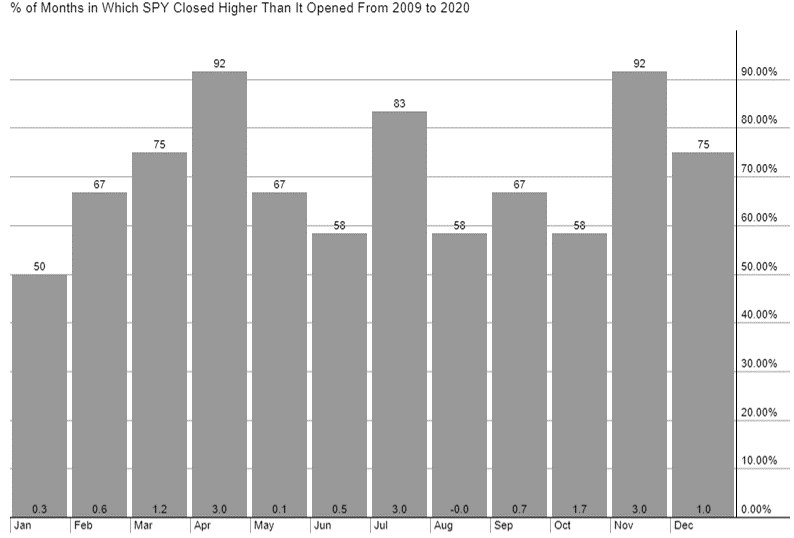
What can you tell from this bar chart?
We are in late Sep 21. Oct 21 is fast approaching which means that there’s a high chance that the US stock market (SPY) may continue to experience a decline.
Here’s another characteristic of SPY – Quarter 3 tends to be more volatile than the rest of the year.
#3 Confirmation
This is the next thing you’ll want to look for before buying the dip. Why?
Price can continue to dip or slide. This would cause you unnecessary losses and emotional pain. Please don’t torture yourself by going through the same journey as I.

From the daily chart of SPY above, can you tell if the dip has truly ended?
Referring to the chart below, is the answer clearer?
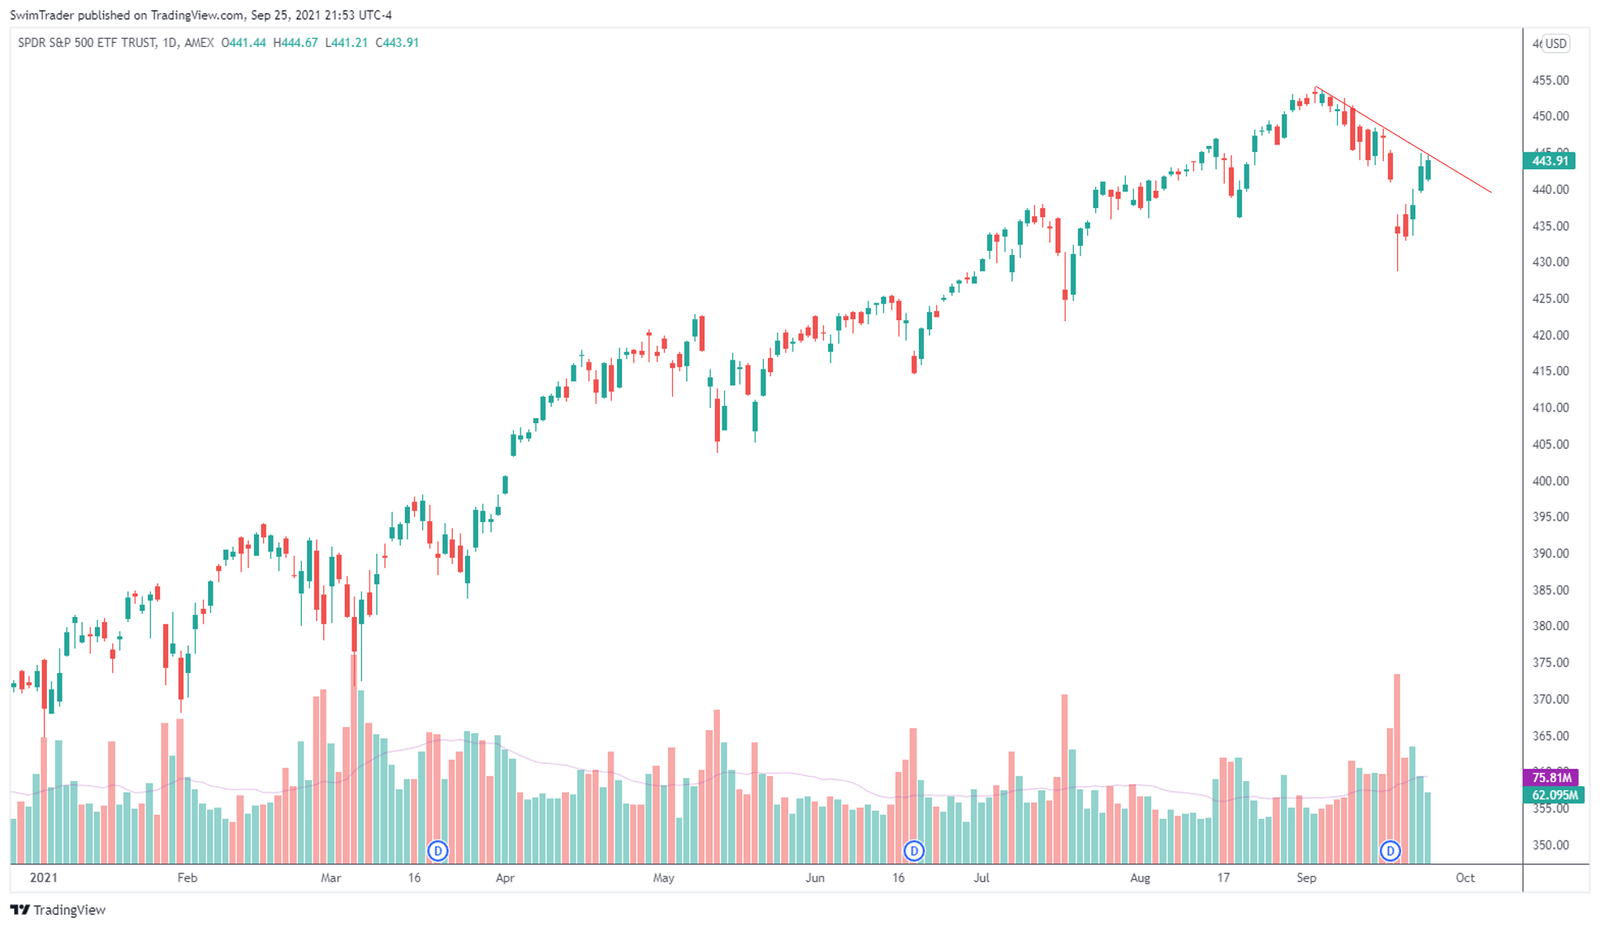
You can see that price have yet to break its downtrend line from 2 Sep 21. This indicates that prices are likely to continue falling.
If and when prices break this downtrend line, when will the ideal time to buy and invest? Here’s where the weekly TPB Swing strategy comes into play.

Did you notice the green weekly TPB signals on the weekly chart of SPY? Those are signals for you to standby and enter only when prices have moved higher to confirm that the uptrend is continuing.
Since the weekly TPB signal isn’t on now, it’s prudent to wait for the next signal and ride the trend.
Based on the TPB weekly strategy, the time to buy and hold SPY was in late Jun 20 and early Nov 20. Your stop loss wouldn’t be triggered; you’d be invested in SPY for over a year!
If you’re looking to trade instead of invest, you can use the daily TPB Swing strategy.
Both the daily and weekly TPB strategies are proven. They have been thoroughly tested and provide you with a framework to prevent you from falling victim to stop loss hunting. You can read more about the 2 TPB strategies here.
5 Things You Must Remember

#1 Dips in the stock market can turn into a slide in prices
#2 Knowing how to interpret market psychology is crucial
#3 Candlesticks are rich in details
#4 Wait for price confirmation before buying
#5 Utilize the weekly TPB Swing strategy for improved timing and results
Here’s What You Can Do To Improve Your Trading Right Now:
#1 Register for our market outlook webinars by clicking here
#2 Join us in our Facebook Group as we can discuss the various ways of applying this by clicking here
#3 Never miss another market update; get it delivered to you via Telegram by clicking here
#4 Grab a front row seat and discover how you can expand your trading arsenal in our FREE courses (for a limited time only) by clicking here
Invest safely!
