
Traders get excited when they see this chart pattern. The double top and double bottom chart patterns appear infrequently. But when they do appear, seize them and you will be handsomely rewarded.
Discover how you can profit from this chart pattern through this case study on McDonald’s (MCD).
What’s The Cause Of The Double Top/Bottom Pattern?
Double top: The bulls are out to push prices into new highs.
Double bottom: The bulls are out to push prices into new lows.
Spot It Right
A double top/bottom can form in a matter of minutes if you look at the 1 minute or 5 minute chart. It can also take several weeks for the pattern to form if you are looking at the daily or weekly charts.
A double top includes:
- 2 peaks which form a M
- Second top is formed with less volume compared to the first
- Peaks may not form at the same price
- More tops may even be formed

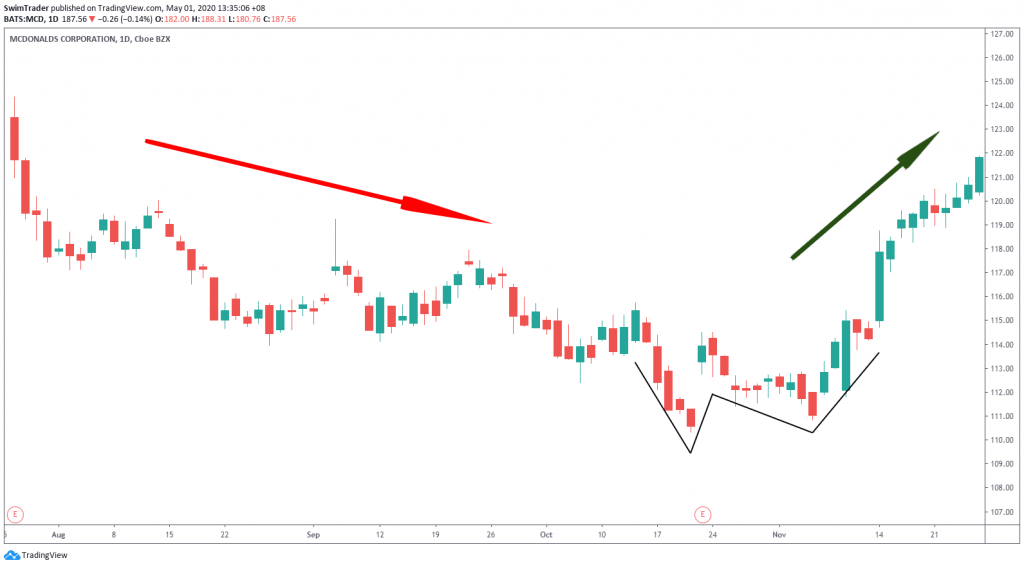
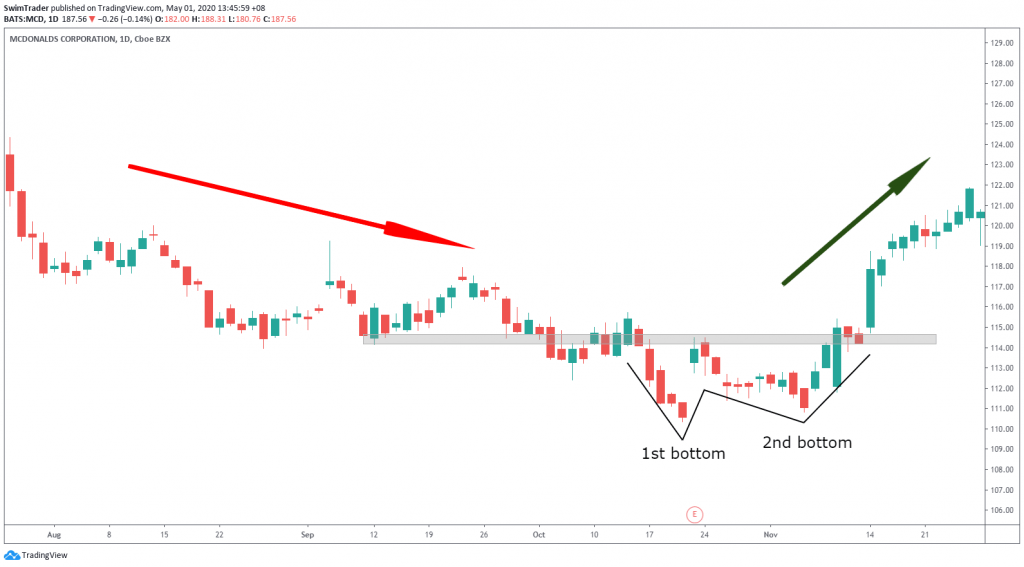
A double bottom includes:
- 2 troughs which form a W
- Second bottom is formed with less volume compared to the first
- Troughs may not form at the same price
- More tops may even be formed
Give yourself some leeway because charting is both an art and science.
What Happens At The Top/Bottom?
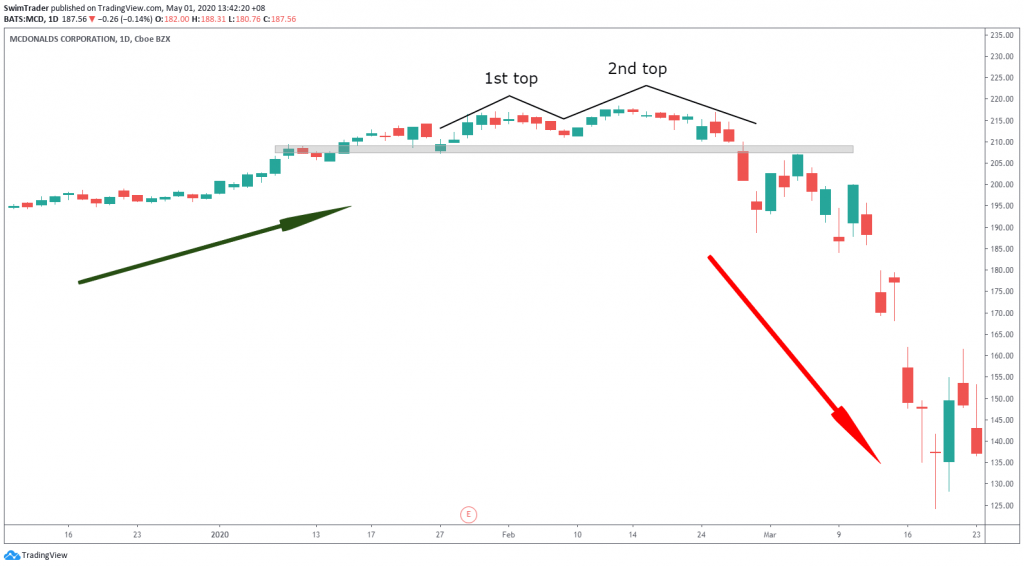
A double top indicates that market participants remained bullish at the first retracement from the top. Hence, there is a second bullish move to test the high (which was set previously). The high gets tested and remains intact. The bulls have lost steam; they are exhausted. The bears take charge from there.
It is the direct opposite for the double bottom. Market participants are bearish at the first retracement from the bottom. This leads to a second bearish move to test the low (which was set previously). The low gets tested and remains intact. The bears are exhausted and the bulls take charge from there.
Show Me The Money
There are 2 ways to trade this chart pattern:
#1 Breakout Trade

- Watch for price to break the support zone (double top) or resistance zone (double bottom)
- Enter your position according to the direction of the breakout the next session
- For a double top, go Short. For a double bottom, go Long
- If you are trading using the hourly chart, enter the trade an hour later
- If you are trading according to a daily chart, enter the trade on the next day
#2 Pullback Trade

- Watch for price to break the support zone (double top) or resistance zone (double bottom)
- Wait for the price to pull back to the area near the support zone (double top) or resistance zone (double bottom) and enter your position the next session
- For a double top, go Short. For a double bottom, go Long
- If you are trading using the hourly chart, enter the trade an hour later
- If you are trading according to a daily chart, enter the trade on the next day
Conclusion
Trading the double top and bottom chart patterns can be hugely profitable. It requires patience and the ability to ride out the trend as the start of any trend tends to be choppy. Hang in there as you ride the volatility to enormous gains!
Here’s What You Can Do To Improve Your Trading Right Now:
#1 Register for our market outlook webinars by clicking here
#2 Join us in our Facebook Group as we can discuss the various ways of applying this by clicking here
#3 Never miss another market update; get it delivered to you via Telegram by clicking here
#4 Grab a front row seat and discover how you can expand your trading arsenal in our FREE courses (for a limited time only) by clicking here
Trade safe!
