
“Haagen-Dazs ice cream again?”
I cannot resist a cup of good ice cream in this hot weather.
As I sat to enjoy my cup of ice cream, I decided to find out more about Haagen-Dazs. Upon a quick search, I discovered that this ice cream brand is under General Mills!
General Mills is a giant in the consumer staples sector. It manufactures and sells packaged food globally, and has a market capitalization of more than $45b, ranking them as the world’s 333rd most valuable company.
Instinctively, I took a look at its chart. Oh boy, I’ve found a gem!
Shall we examine General Mills (GIS)?
Performance Of US Stock Market vs General Mills
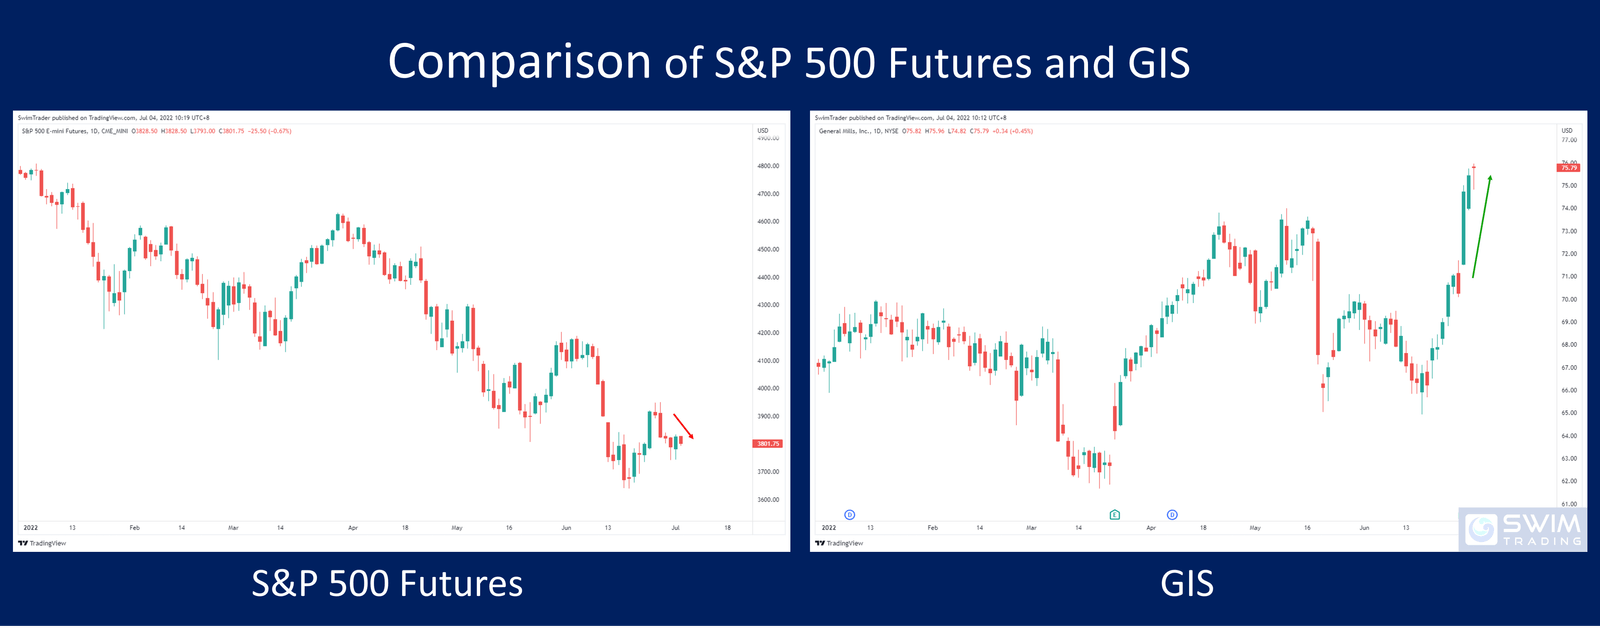
Because the S&P 500 futures is up and running 24/5, many professional traders look at it. To have an edge over the rest of the retail traders, you’ll want to look at what the professionals are paying attention to.
The S&P 500 futures was bearish the whole of last week. This is expected as it has been bearish since the start of 2022.
Can the same be said of the chart of GIS? Let’s have a look.
The share price of GIS was in a downtrend in early 2022, similar to the S&P 500 futures.
However, the price trend of GIS turned up since mid-Mar 22 before a complex pullback from May to mid June 2022, and the resumption of the uptrend since then.
Last week, the share price of GIS performed admirably, shooting up by more than 7%. This is a remarkable feat against the S&P 500 futures which declined about 2%.
Having found the performance of GIS to be much stronger than the S&P 500 futures, it’s time to see if GIS has been explosive for a quick swing trade.
How Explosive Is GIS?
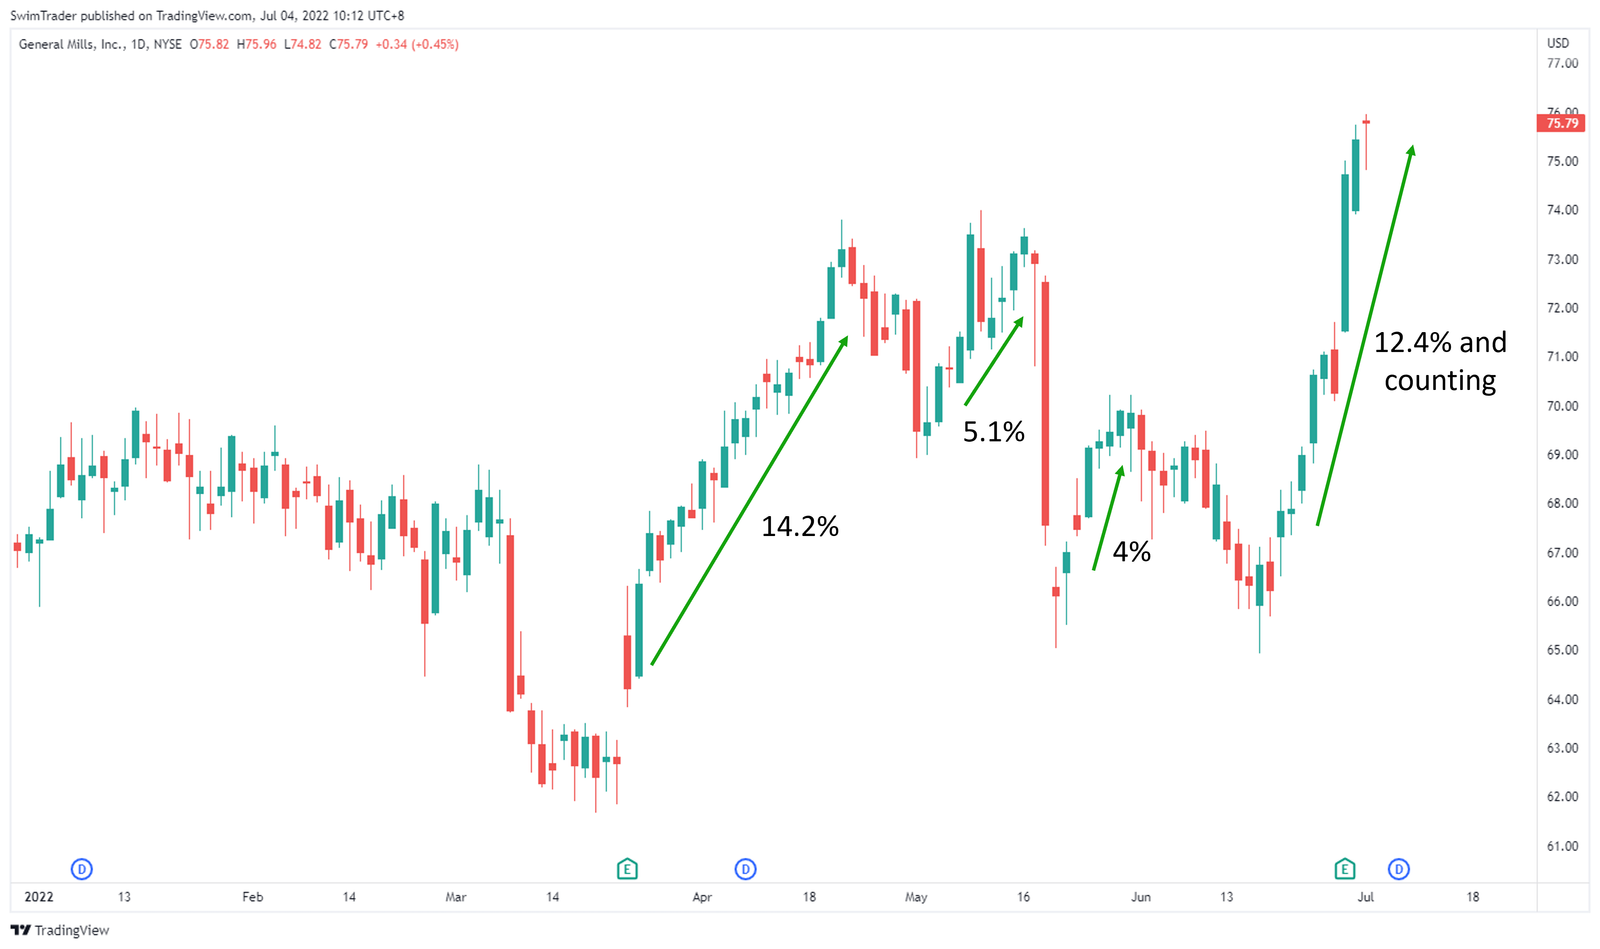
After a downtrend in early 2022, GIS exploded upwards by 14.2% when a new uptrend was formed.
While pulling back, GIS enjoyed reasonably strong up moves of 5.1% and 4%. After which, the uptrend resumed and GIS shot up by 12.4% and counting!
This is proof that GIS has the ability to explode upwards in a short period of time, despite being a huge company.
Is it an appropriate time to enter GIS now?
To answer this question, you’ll need to uncover its key price levels. And that’s the very next step.
Key Price Levels
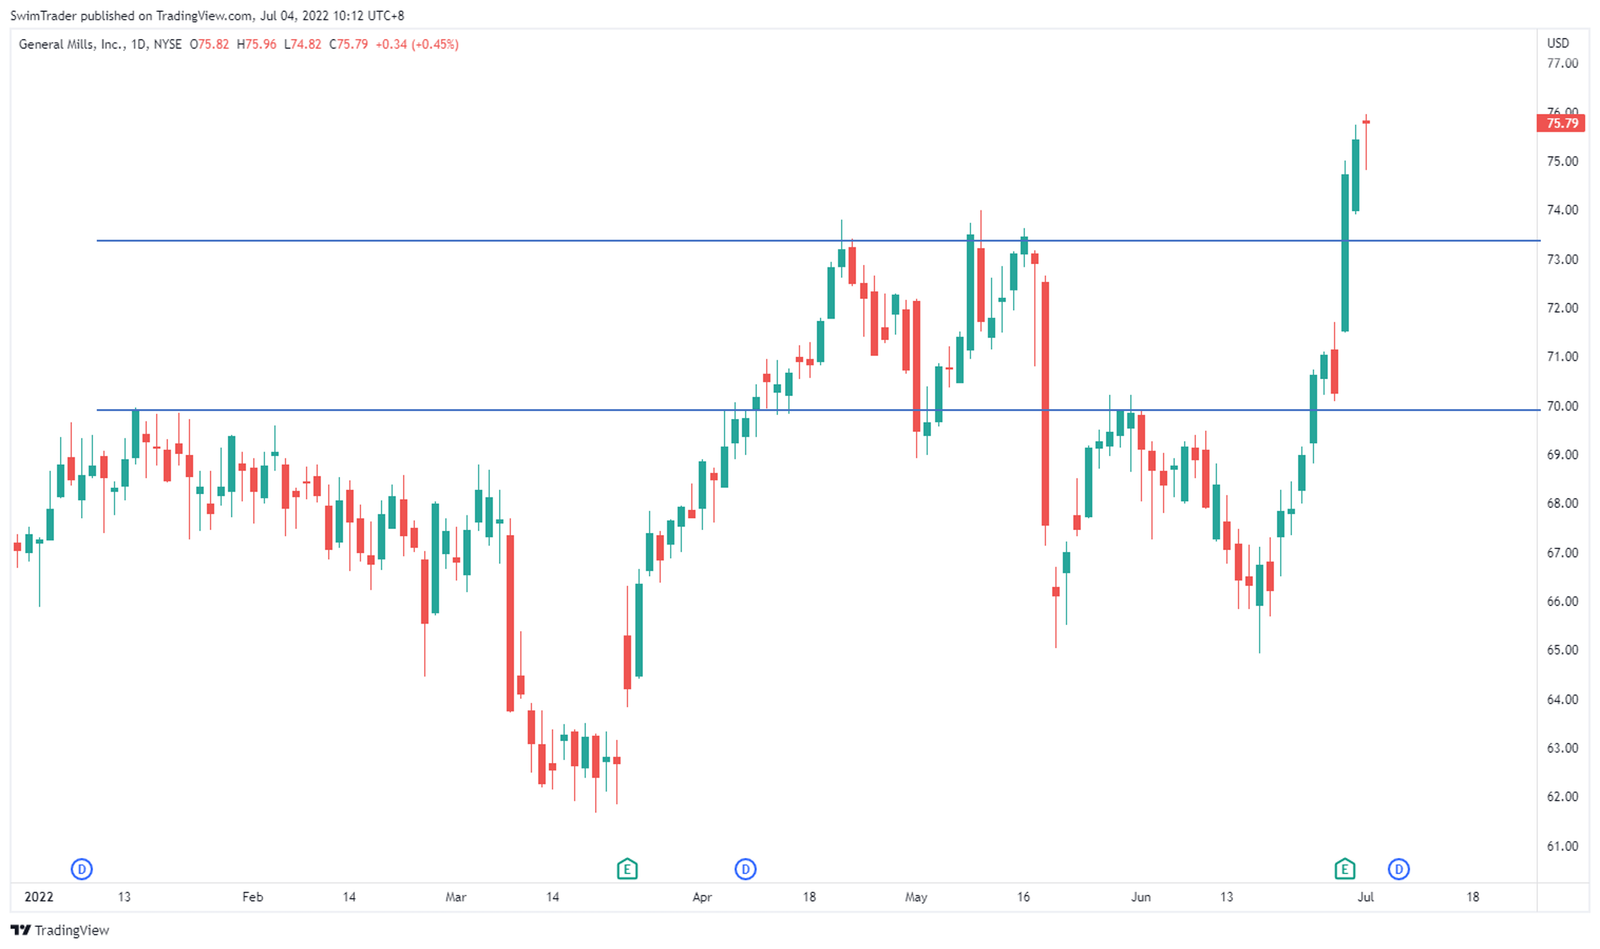
Key price levels will illuminate potential support and resistance turning points. This will help you know if you are buying at the price zone which is considered cheap or overpriced.
Performing this analysis is also critical to help you evaluate if there’s sufficient headroom for its price to increase to make your trade worthwhile.
From the chart above, you can see that there’s an immediate support zone at $73.50. This means that if the price of GIS were to drop, it could drop to $73.50 and bounce upwards.
There’s another support zone below that – at $70. If the support level at $73.50 fails to hold, then the price GIS could go lower to $70 before bouncing upwards.
Given that the price of GIS has shot up to $75.79 without a decent pullback, I would expect a pullback to happen in the coming days to around $73.50 before heading higher.
Does this mean that you should camp at $73.50?
No!
There’s a set of events that I’m watching out for before placing my entry.
The Strategy You Can Use To Trade GIS
Here, you’ll be planning your entry, profit taking, and stop loss levels.
In every trading strategy, you must know your entry, profit taking, and stop loss levels to stay in business. Yes, trading is a business indicating that the strategy you use must be well formulated too.

Using The Art of Explosive Profits framework (AEP for short), I’d like for the price of GIS to pull back to $73.50 or slightly lower before heading higher.
As its name suggests, you’ll be looking to catch an explosive move in a short period of time consistently.
In the AEP course, you’ll be coached on how to search for strong stocks like GIS instead of relying on news and hear-say.
You’ll also become fluent in reading charts to shortlist stocks that are about to have an explosive move.
Finally, you’ll learn how to identify the optimized entry, stop loss, and take profit level to capture these explosive moves that you’ve been waiting for (in a safe manner, of course)!
Have a look at the AEP framework and add this explosive trading strategy to your arsenal to seize more trading opportunities.
Why Is GIS The Stock Pick Of The Week?
![]()
Source: www.generalmills.com/
While the overall US stock market remains bearish, market participants are hugely optimistic on GIS. This can be inferred from the rising share price of GIS after Mar 22.
GIS has lived up to the expectations for a quick swing as it has experienced 4 large up moves in the past 6 months, with the largest measuring more than 14%!
A trading opportunity is near as I would wait for the price of GIS to pull back before taking action.
Please note that I’m no financial advisor, so I encourage you to treat this edutainment and do your own research.
Lastly all photos and images are from unsplash.com, pexels.com, pixabay.com, and tradingview.com.
Here’s What You Can Do To Improve Your Trading Right Now:
#1 Join us in our Facebook Group as we can discuss the various ways of applying this by clicking here
#2 Never miss another market update; get it delivered to you via Telegram by clicking here
#3 Grab a front row seat and discover how you can expand your trading arsenal in our FREE courses (for a limited time only) by clicking here
Trade safe!
