
Have you dropped something sharp? Did you try to catch it as it was falling?
The stock market is brutal. Buying into the stock market while it is falling is akin to catching a knife with your bare hands while it is falling. Why not wait for the knife to land before picking it up?
How do you know stock market has completed the decline and is ready to climb again? This is where candlesticks have an important role to play. Candlesticks can provide you with an edge by entering the market at the right time.
#1 How To Read Candlesticks?
Charts can be displayed in several ways – lines, bar, candlesticks and more.
In the diagram below are 2 of the most popular charting types – bar and candlestick.
Why are they so popular? Both bar and candlestick charting types are more visual and tell a story. They tell viewers the opening and closing price (aka Open and Close), the high and low price for that period (aka High and Low), and the overall sentiment of that period.

As shown above, there are only 2 differences between bars and candlesticks. The first difference is that the Open price is always on the left of each bar and the Close price is always on the right of each bar.
The Open and Close price for candlesticks are read in a vertical manner. When a particular candle is bullish, it will be green in color. The Open price will be below the Close price.
In contrast, when a candle is bearish, it will be red in color. Here, the Open price will be above the Close price.
Secondly, bars do not have a body, which is the enlarged shared area which exists between the Open and Close price of a candle.
The lines that are outside the body are known as shadows. These shadows tell the extreme prices which the bulls and bears have pushed to during that session.
Personally, I prefer the candlestick charting layout.
#2 What Can You Infer?
You can read the momentum of the candle. If you see tall green candles which also have long bodies, you can tell that the bullish momentum is very strong.
The reverse is the same for tall red candles with long bodies. This tells you that the bearish momentum is very strong.
Being a trend follower, you want to be in the direction of the trend. Oppose the trend and you will suffer huge losses, as explained in the following example.
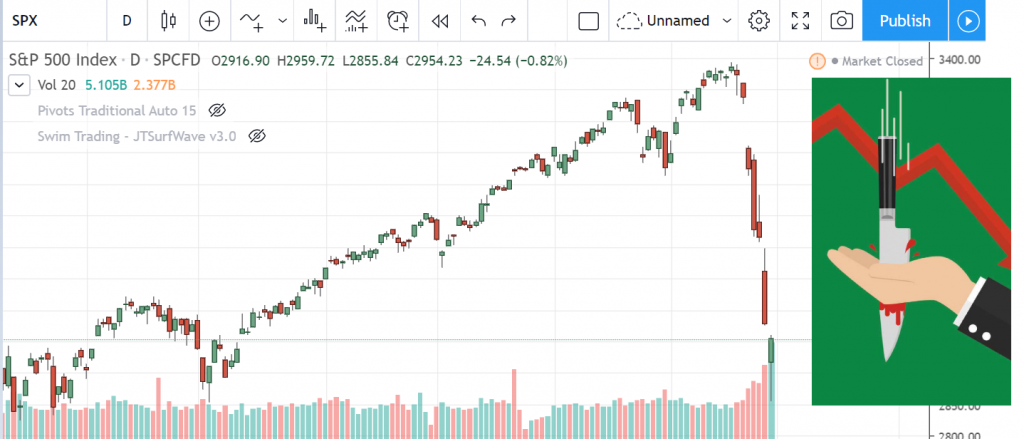
The stock market crashed in the final week of February 2020, breaking through a number of support levels. Do you see the tall red candlesticks? What do you notice about the body of the red candles? The body of the red candles were quite tall, suggesting severe bearish sentiments.
Never catch a stock while it is on its way down; never catch a falling knife.
Armed with this knowledge, you will not enter to buy stocks (or S&P 500 in this case) as the knife is still falling. Instead, you will wait for prices to stabilize and start trending upwards again. This is because SPX has been on a massive uptrend since 2009.

Above: Chart of SPX recovering from a huge decline in December 2018.
It has found the floor after 2 weeks. Market participants started to purchase SPX, causing its price to increase with huge bullish candles. The resumption of the long-term uptrend is confirmed after the initial retracement. This is when you should enter.
Conclusion
Candlesticks charts are rich in details, allowing you to read the market better. The quality of your trading decisions will thus improve, improving your results.
Come back next week as we explore more about candlesticks and the various strategies to use for each scenario.
You will get to see how we trade using candlesticks.
Here’s What You Can Do To Improve Your Trading Right Now:
#1 Join us in our Facebook Group and share your questions as we learn and grow.
#2 Never miss another market update; get it delivered to you via Telegram.
#3 Grab a front row seat and discover how you can expand your trading arsenal in our FREE courses (for a limited time only).
See you around!
