
This stock hasn’t been in the news for some time.
In the world of trading, not being in the news is good news.
This is because there’s less frantic buying and selling, resulting in price and profit predictability.
One other such stock is DexCom, which was discussed 2 weeks ago.
Things went according to plan and it flew 7.52% in just 3 days!
Its explosive up move didn’t stop there. Earnings was much better than anticipated, and its explosive up move measured a total of 26.2%!
Ok, that’s enough of history. Let’s analyze the shares of T-Mobile.
Performance Of US Stock Market vs T-Mobile (TMUS)

Can you spot the only similarity between the chart of the S&P 500 futures and T-Mobile’s share price?
Both experienced a bearish week.
Let’s have a look at their differences.
The chart of the S&P 500 futures is in mid-term downtrend while the chart of T-Mobile’s shares is in a mid-term uptrend.
While the S&P 500 fell by 3.3%, the shares of T-Mobile fell by only 0.67%.
Therefore, you can assuredly conclude that the shares of T-Mobile is an outperformer.
This ticks off the 1st checkbox you need to consider when taking a long swing trade.
Now, shall we have a look at the explosiveness of the shares of T-Mobile?
How Explosive Is T-Mobile (TMUS)?
When the share price of a company is lethargic, little money is to be made. Time lost is an opportunity lost to potentially profit more in the stock market.
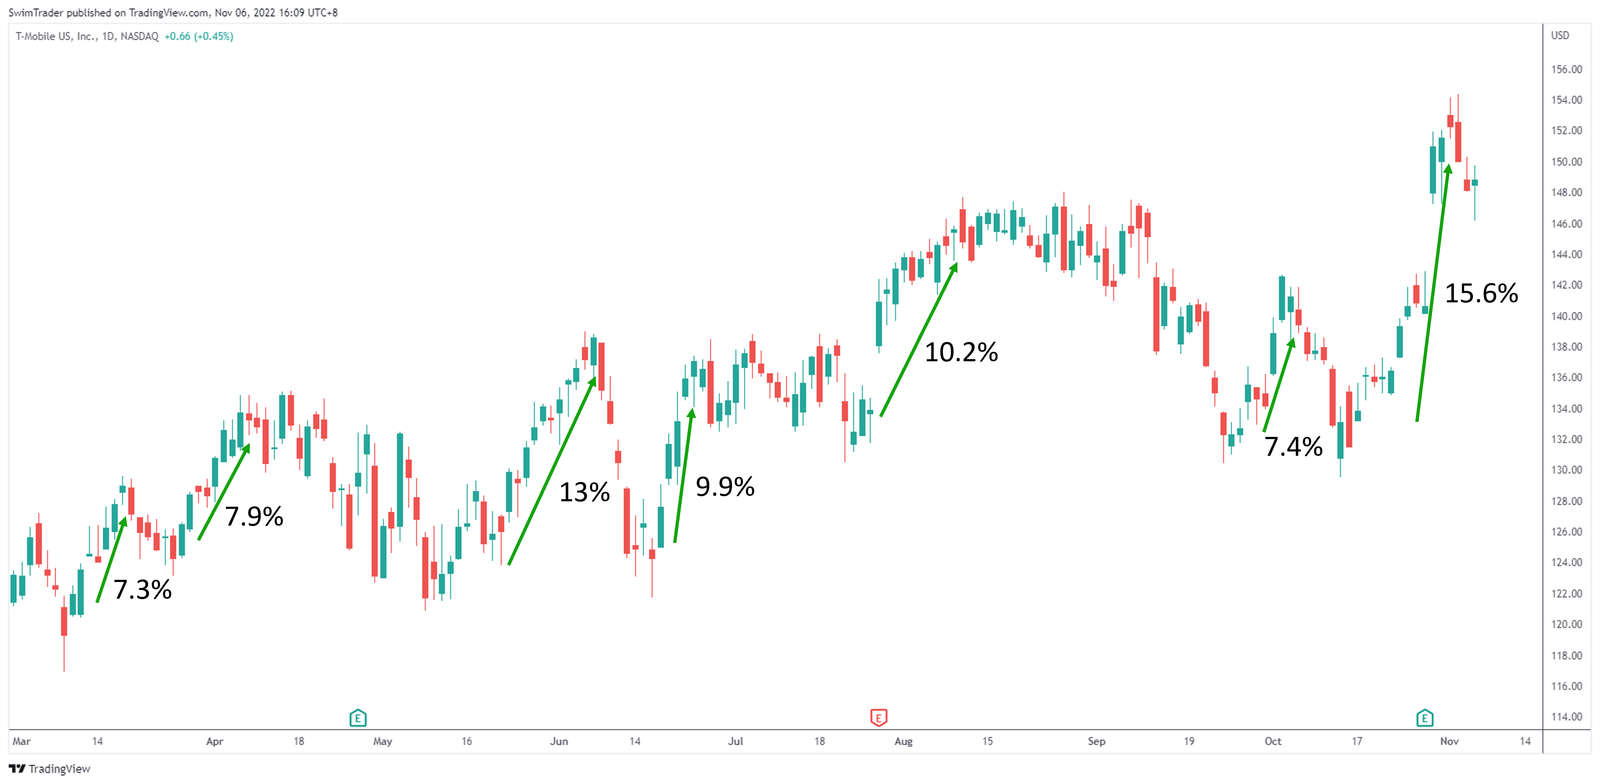
So, let’s have a look at the up moves of T-Mobile’s shares.
The shares of T-Mobile has enjoyed 7 huge runs in the past 6 months. Each run up measures at least 7%, with the largest measuring 15.6%!
With a market capitalization of more than $185b, T-Mobile’s shares is explosive!
Great, this stock has the potential to explode in price, making you a sizable return in a short period of time. Is this all that you need to consider?
Not quite yet!
Let’s uncover the key price levels of T-Mobile’s shares to identify an optimal price for a swing trade.
Key Price Levels
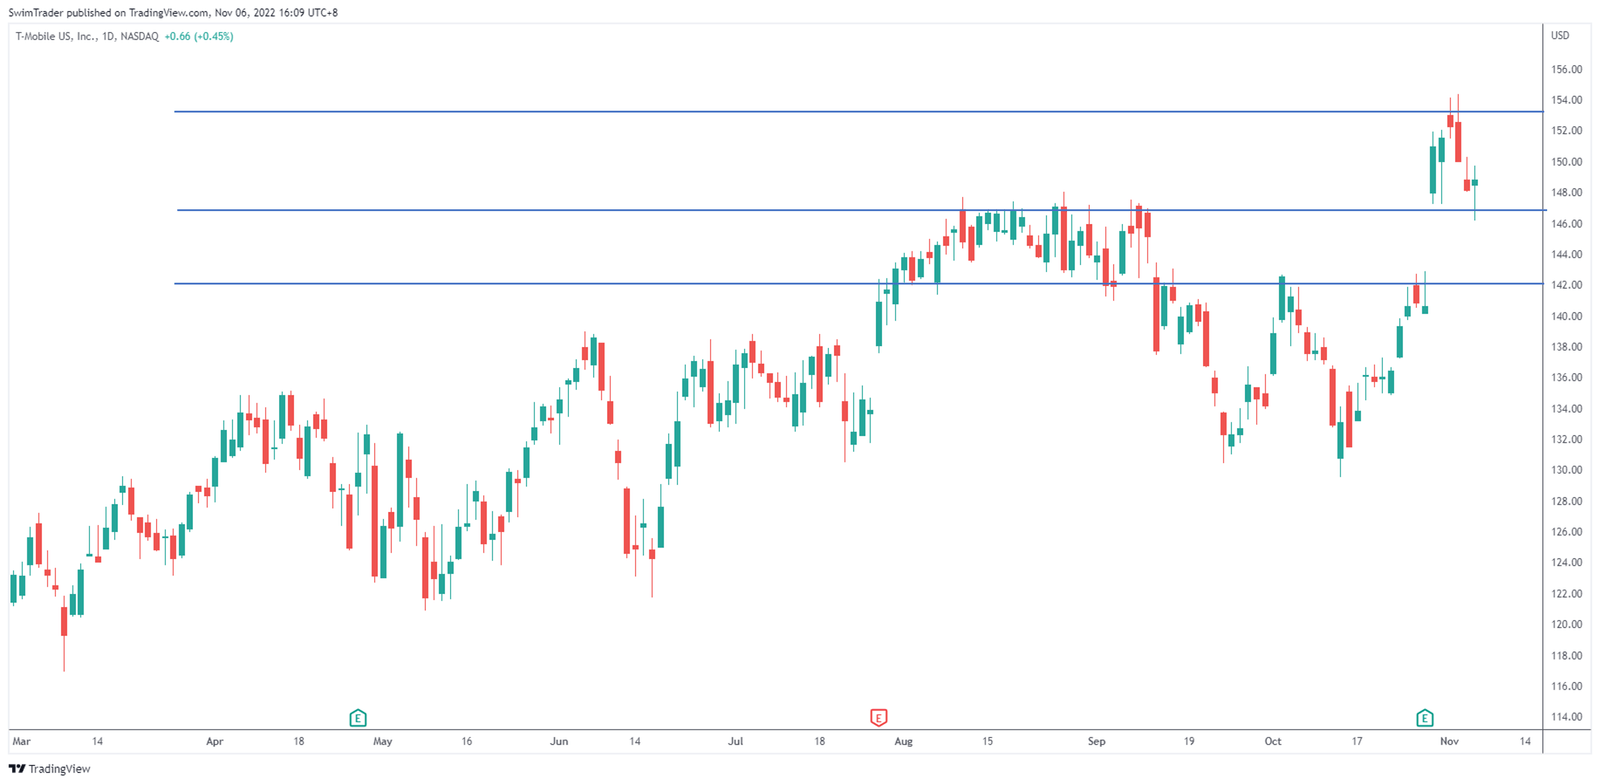
I’ve uncovered the key price levels of T-Mobile’s shares to save you time.
You can see that there’s an immediate support zone at around $147.
Below that, at around $142 lies another support zone.
Its immediate resistance zone lies at around $153.
These price zones suggest that should the share price of T-Mobile soar in the next few days, it would possibly get tested at ~$153.
Should the share price of T-Mobile fall, it could be well supported at ~$147 1st. If the support area around $147 is breached, its price could be supported at around $142.
So, should you go and place an order for shares of T-Mobile immediately?
No.
I think that the share price of T-Mobile could fall to around $147 before exploding to $153 in the coming days to weeks.
The Strategy You Can Use To Trade T-Mobile (TMUS)
After comparing the performance of TMUS with the broader US stock market, determining if TMUS has experienced explosive up moves, and identifying its key price levels, it’s time to talk strategy.
To stay in business, you must know your entry, profit taking, and stop loss levels in every trading strategy. Yes, trading is a business, which means that your strategy must be well thought out.

Using The Art of Explosive Profits (AEP) framework, I’d like to see TMUS pullback a little more before considering an entry.
As the name implies, you’ll be looking to consistently catch an explosive move in a short period of time.
Instead of relying on news and hearsay, the AEP course will teach you how to look for strong stocks like TMUS.
You’ll also learn how to read charts and identify stocks that are about to make a big move.
Finally, you’ll learn how to identify the optimal entry, stop loss, and take profit levels to capitalize on these explosive moves (in a safe manner, of course)!
Have a look at the AEP framework and incorporate this explosive trading strategy to your arsenal to capitalize on more swing trading opportunities.
Why Is T-Mobile (TMUS) The Stock Pick Of The Week?
![]()
While the S&P 500 futures has been trending lower, the price of TMUS has been climbing. This outperformance shows that market participants are hugely optimistic on this stock, increasing your chance of success.
TMUS has displayed its ability to explode in price in a short period of time, between 7.3% and 15.6%! Such explosive price movements are a normal occurrence for this mega cap stock, giving me the assurance that its share price could rocket again in the near term.
In addition, a pullback is taking place. I hope for a slightly deeper pullback before I apply the AEP framework.
While I await the opportunity, please keep in mind that I’m not a financial advisor, so please treat this as edutainment and conduct your own research.
Lastly, all photos and images are from unsplash.com, pexels.com, pixabay.com, and tradingview.com.
Here’s What You Can Do To Improve Your Trading Right Now:
#1 Join us in our Facebook Group where we discuss the various ways of applying this by clicking here
#2 Never miss another market update; get it delivered to you via Telegram by clicking here
#3 Grab a front row seat and discover how you can expand your trading arsenal in our FREE courses (for a limited time only) by clicking here
Trade safe!
