
Fear is in the market.
The S&P 500 dropped by 2.2%.
The last time the S&P 500 dropped by 2% or more was in late Sep 21 when the stock market was going through a deep pullback. What happened to the stock market after that drop? It stormed up 10%.
I’m not going to belittle the impact of the new COVID-19 variant found in Africa and other parts of the world. However, the human race has been highly blessed with adaptability and tenacity. We, the human race, have withstood the test of time (financial crises, disease outbreaks, unrest, and more). We have bounced back stronger than before. We can do it!
Amidst the fear and chaos, there’s a stock in the homebuilding industry which you want to pay close attention to.
Big Picture
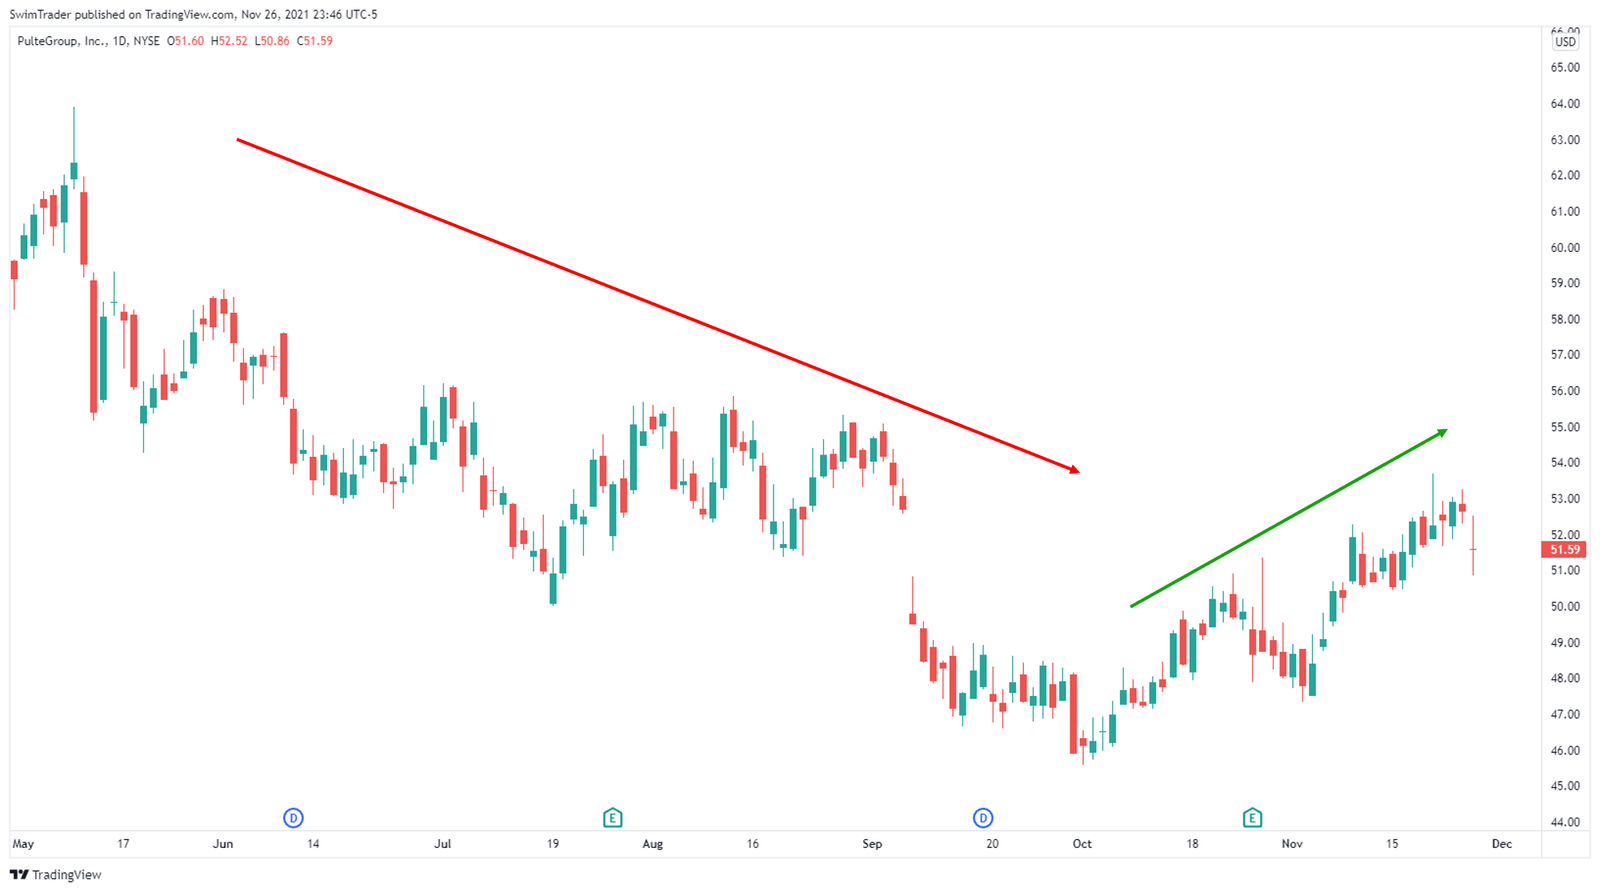
What can you tell from the chart of PluteGroup (PHM) above?
Yes! PHM was in a downtrend from May 21 to Oct 21. Since then, a new uptrend has emerged.
As trend followers, we ride trends by buying in an uptrend, and selling in a downtrend. And there are a couple of ways to read trends under 5 seconds.
But, are there optimal price points to buy at?
Yes! This is what you’ll be uncovering in the following sections.
Key Price Levels
Is there a way to identify key price levels on the chart of PHM?
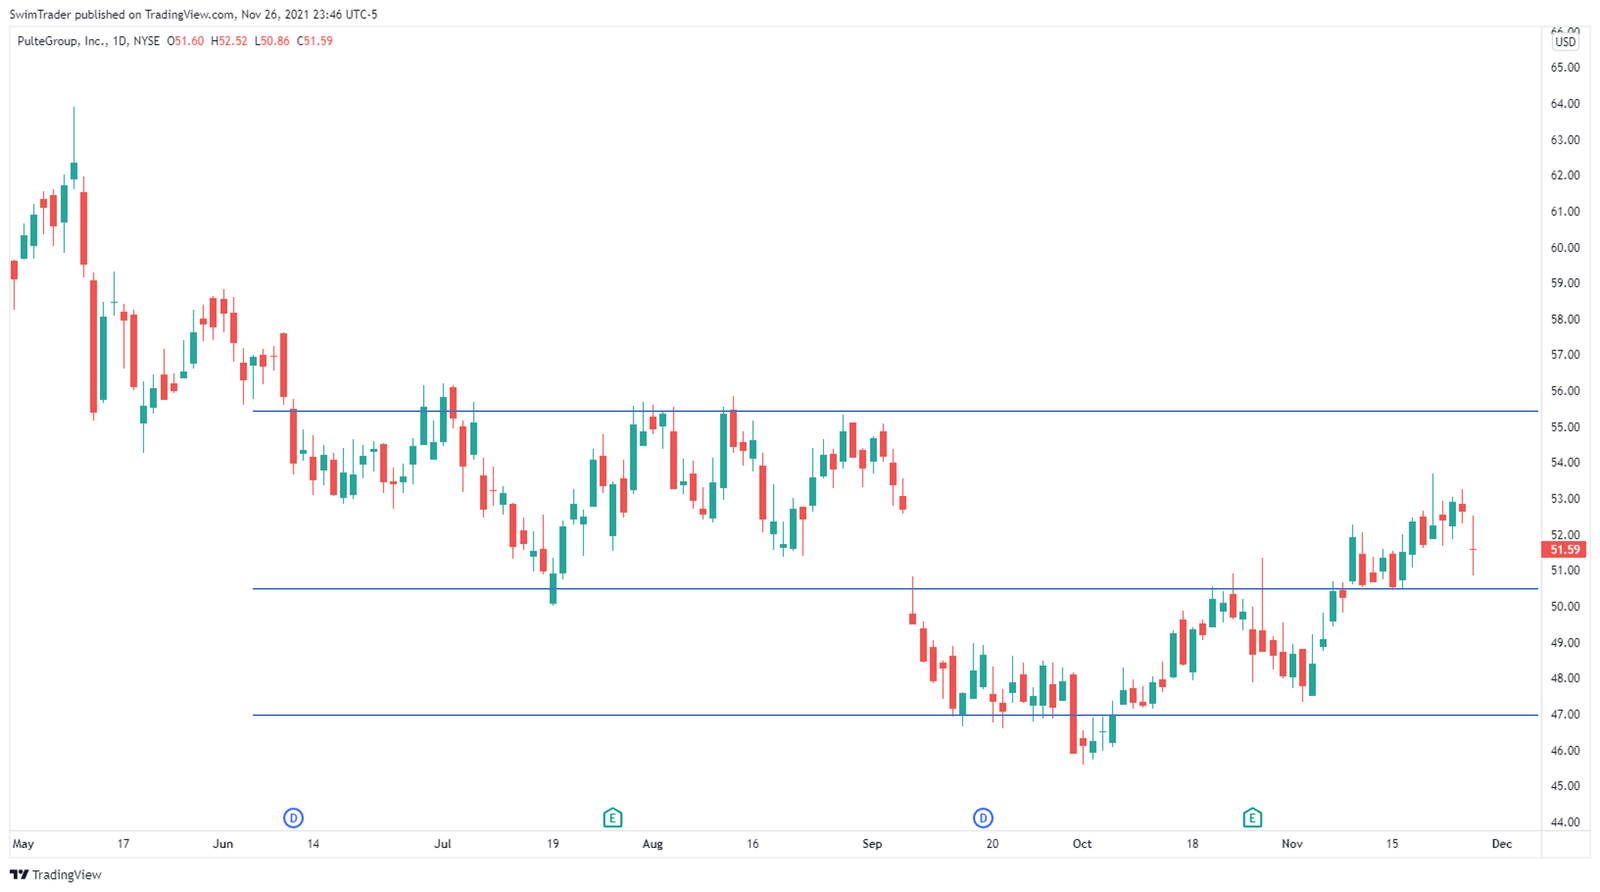
By drawing support and resistance lines. Please don’t be misled by the world “line” as support and resistance are more of zones than specific prices.
Here, we can see that there’s an immediate resistance zone at $55.50, and 2 support zones at $50.50 and $47.
Support and resistance levels are rich in details. They illuminate possible turning points, allowing you to be prepared.
Armed with the key price levels and turning points, let’s have a look at PHM’s internals!
Technically Speaking
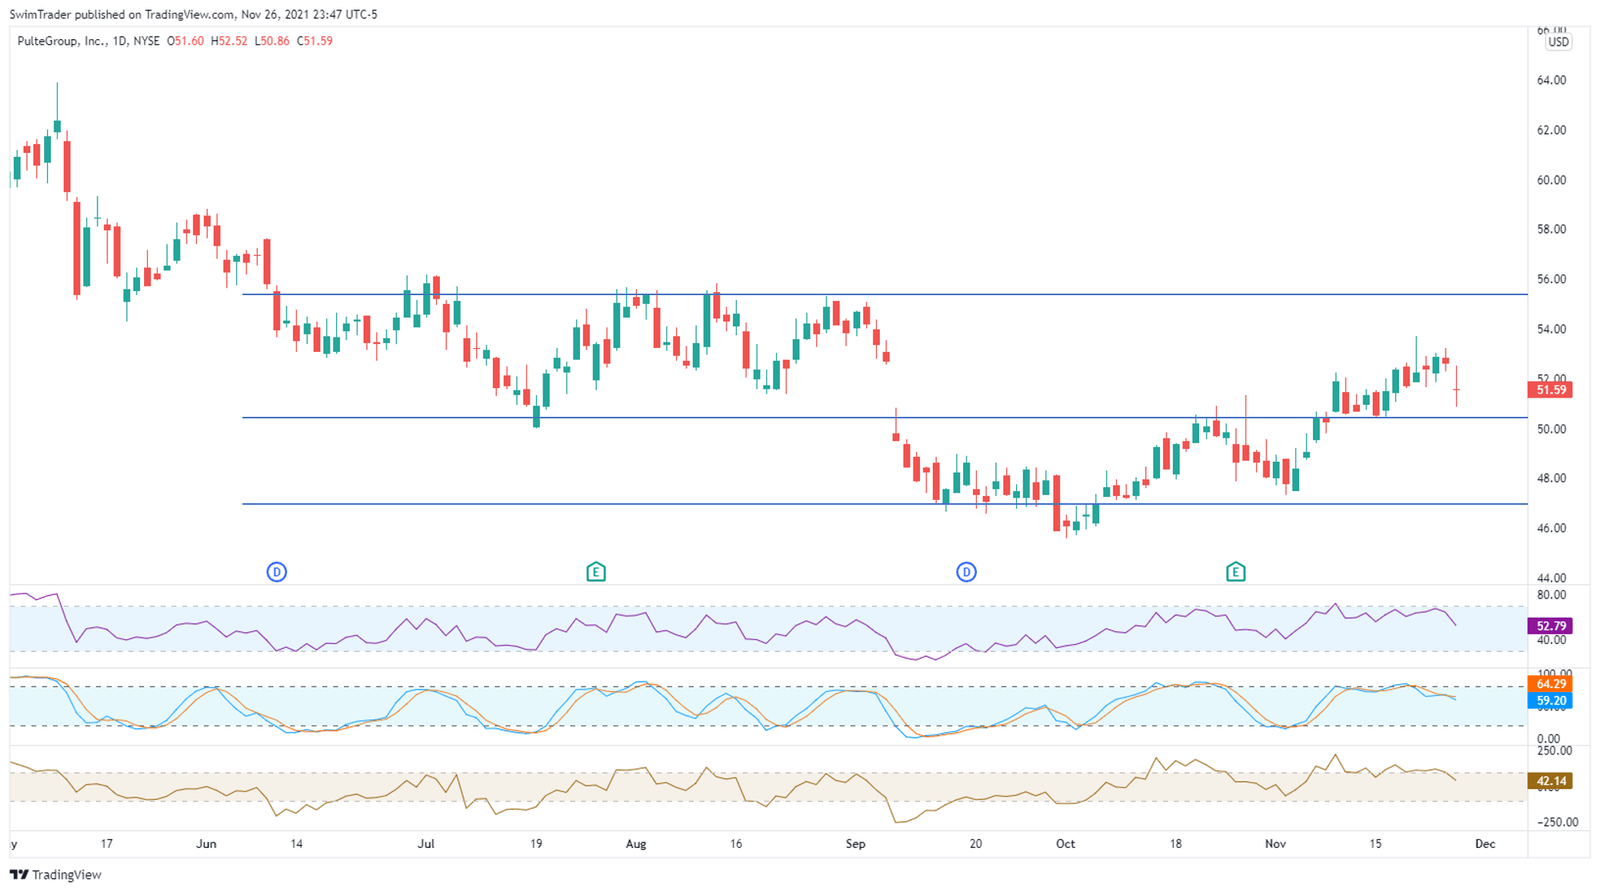
Let’s put on 3 momentum indicators to have a clue if there’s a higher chance of prices of PHM to rise, fall, or stay stagnant.
All 3 momentum indicators are in their neutral zone. However, if you look harder, you’ll notice that they are in the upper area, near to their overbought zone. This suggests that there’s a slim chance that prices of PHM will head up.
What are the possible scenarios for the coming days?
- PHM heads higher towards its immediate resistance level at $55.50
- PHM moves lower to its immediate support level at $50.50 and bounces off it to its immediate resistance level at $55.50
- PHM drops past its immediate support level at $50.50 to its next support level at $47
Which of these scenarios do you think will play out?
Did you miss out anything when planning for this trade?
Yes! Setting a stop loss to protect your trading capital. Setting an appropriate stop loss level is important and this indicator can help you.
Conclusion

A fresh uptrend on PHM has formed. This doesn’t mean that you rush into buying it, based on the analysis we have gone through.
I think that there’s a higher chance of Scenario 2 happening and I’d be waiting on the sidelines for that to play out.
I hate to burst your bubble, but I’m not a financial advisor. Therefore, please treat this article as education and conduct your own research.
Here’s What You Can Do To Improve Your Trading Right Now:
#1 Join us in our Facebook Group as we can discuss the various ways of applying this by clicking here
#2 Never miss another market update; get it delivered to you via Telegram by clicking here
#3 Grab a front row seat and discover how you can expand your trading arsenal in our FREE courses (for a limited time only) by clicking here
Trade safe!
