
It’s lunch time on Sat, 4 Dec 21. My phone buzzed non-stop.
I’d usually ignore all messages during my meals as I spend quality time with my family. But my phone was vibrating almost every few seconds.
So, I took a look at my phone and was surprised. Notifications of price alerts for crypto and messages regarding the sudden drop in crypto prices were flooding in.
Filled with curiosity and disbelief, I took at quick glance at the prices of crypto. My gosh! Many of the crypto in my watchlist had dropped by at least 15%!
Panic was in the streets as I scrolled through my messages.
Is the bear market here?

Let’s analyze Ether (crypto of Ethereum) and find out if this drop is over.
If you would like to learn more about Ethereum and Ether, head over to this recent article to learn about them.
Big Picture
Why are we analyzing Ether (ETH) instead of Bitcoin (BTC)?
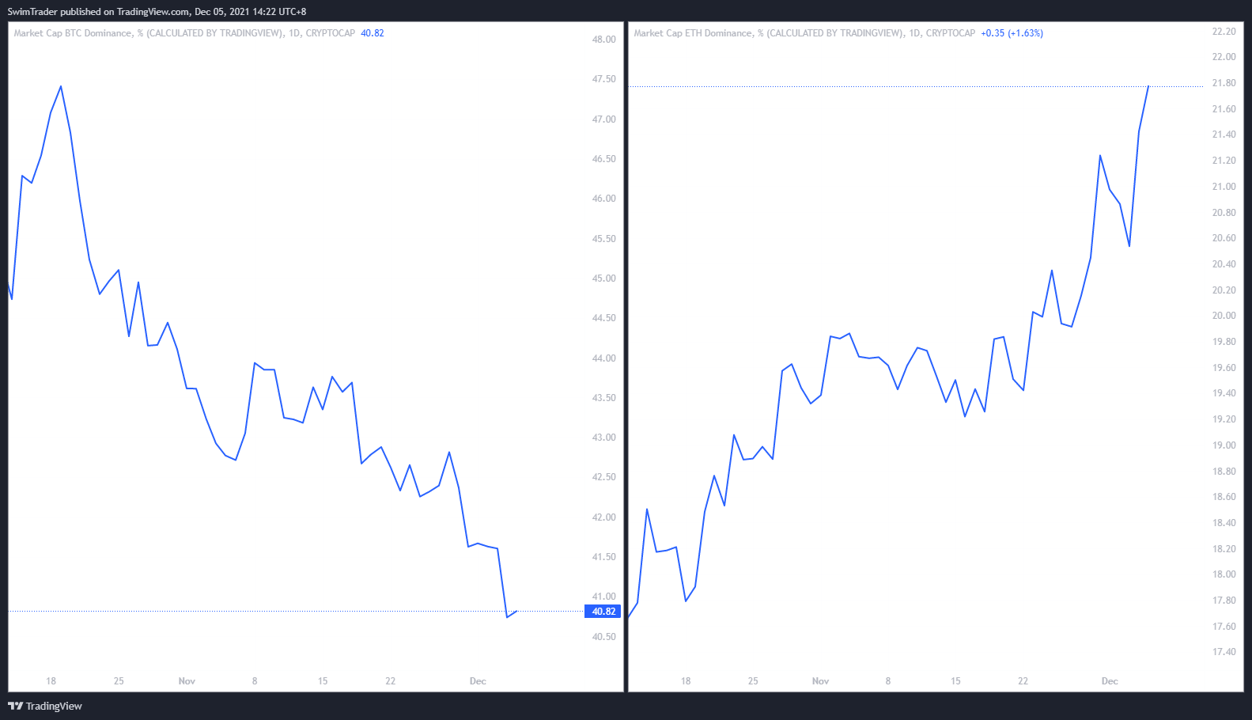
The dominance of ETH in the crypto space is rising steadily while the dominance of BTC is declining rapidly. This implies that ETH is becoming a bigger player in the crypto world, hence the need to pay close attention to ETH.
Here’s how the dominance of BTC (on the left) compares with the dominance of ETH (on the right).
How does the chart of ETH look after the drop on Sat?
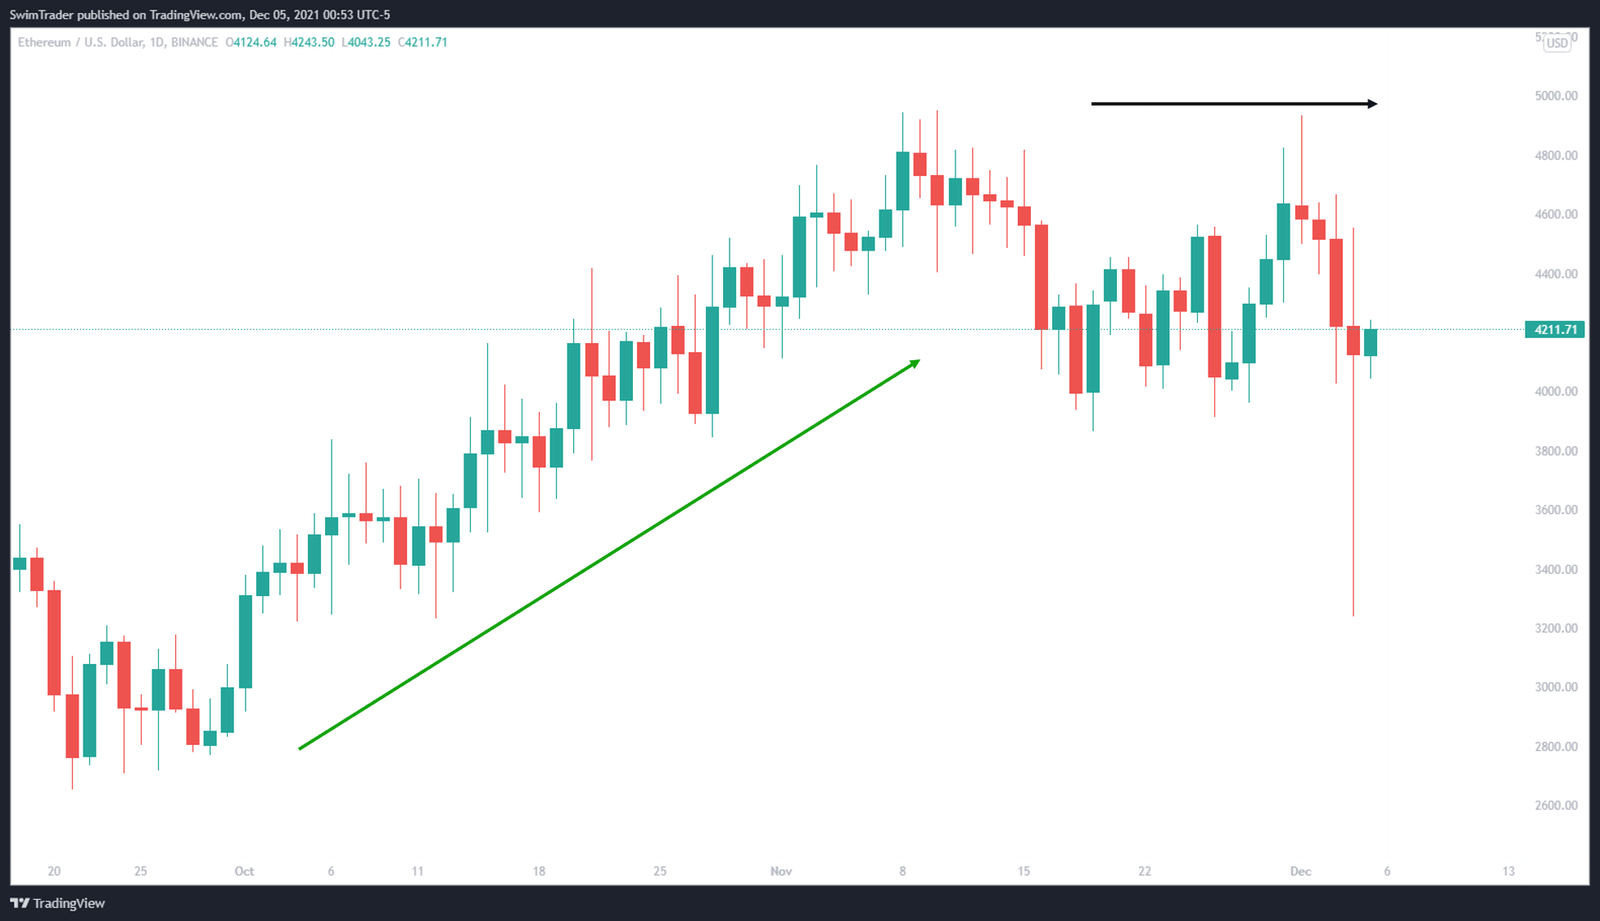
We can tell that ETH was in a mighty uptrend since Oct 21 through to early Nov 21 (as pointed out by the green arrow). As prices shot up, ETH formed several new all-time highs.
Prices of ETH became to stagnate and go sideways from early Nov 21 to today (as pointed out by the black arrow).
What are the key price levels that we should pay close attention to in this volatile market?
Key Price Levels
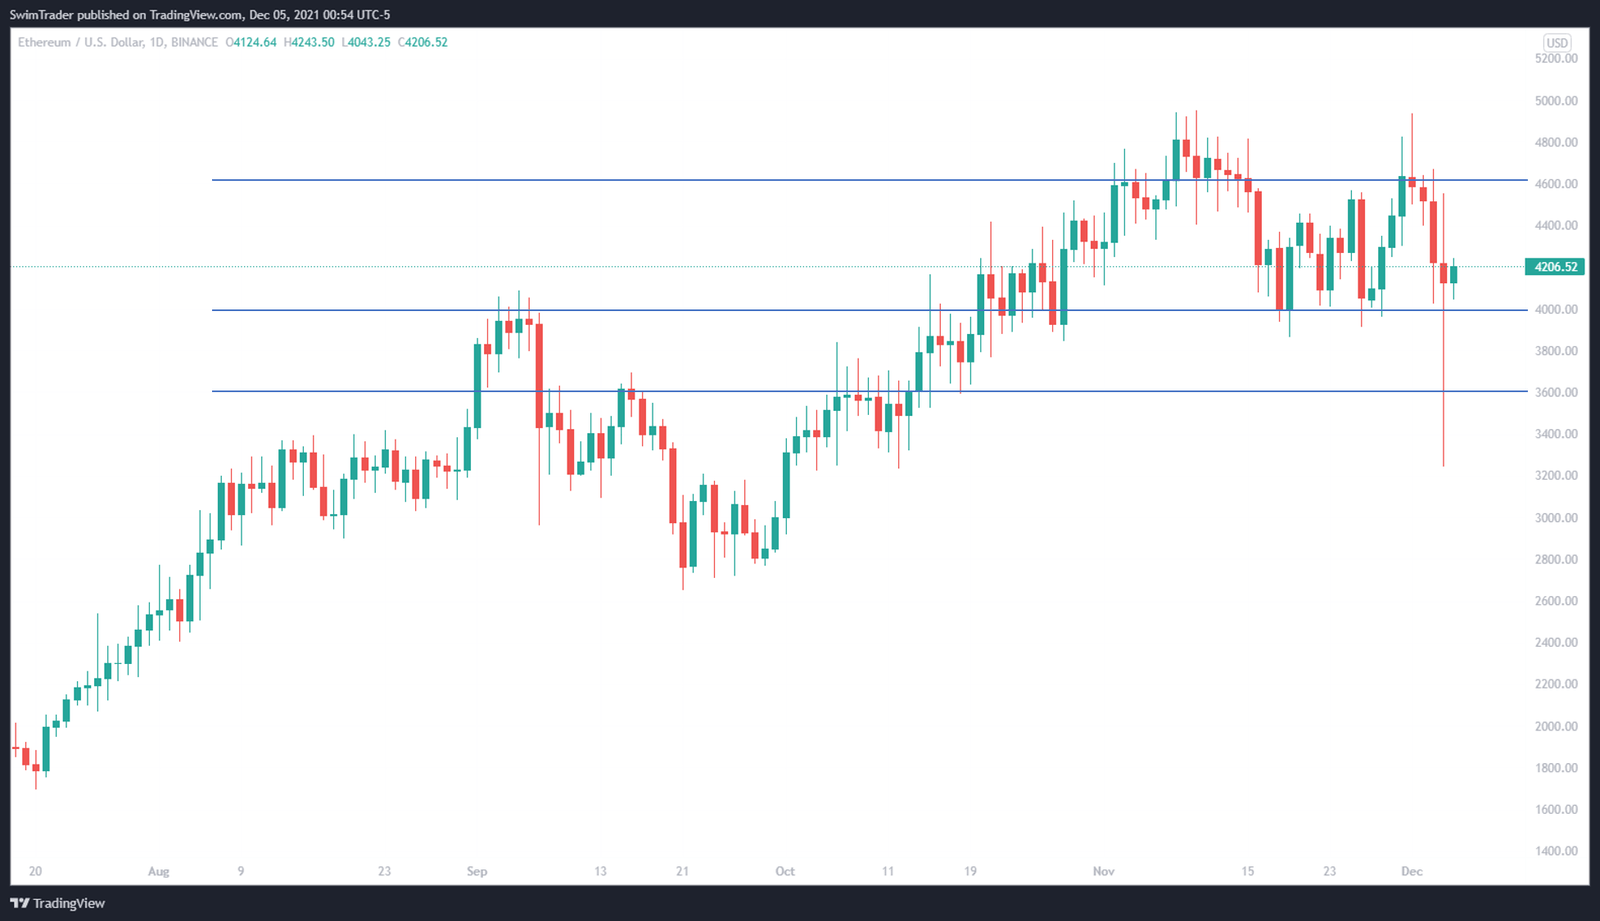
And we have the key price levels drawn out!
Don’t they look like support and resistance zones? Yes, they do!
In fact, support and resistance zones are points where prices may turn, hence they are key price levels.
From the chart above, you can tell that there’s an immediate resistance zone at about $4,600. There are 2 support zones at around $4,000 and $3,600.
Shall we add a trendline to find out if the uptrend line is still intact?
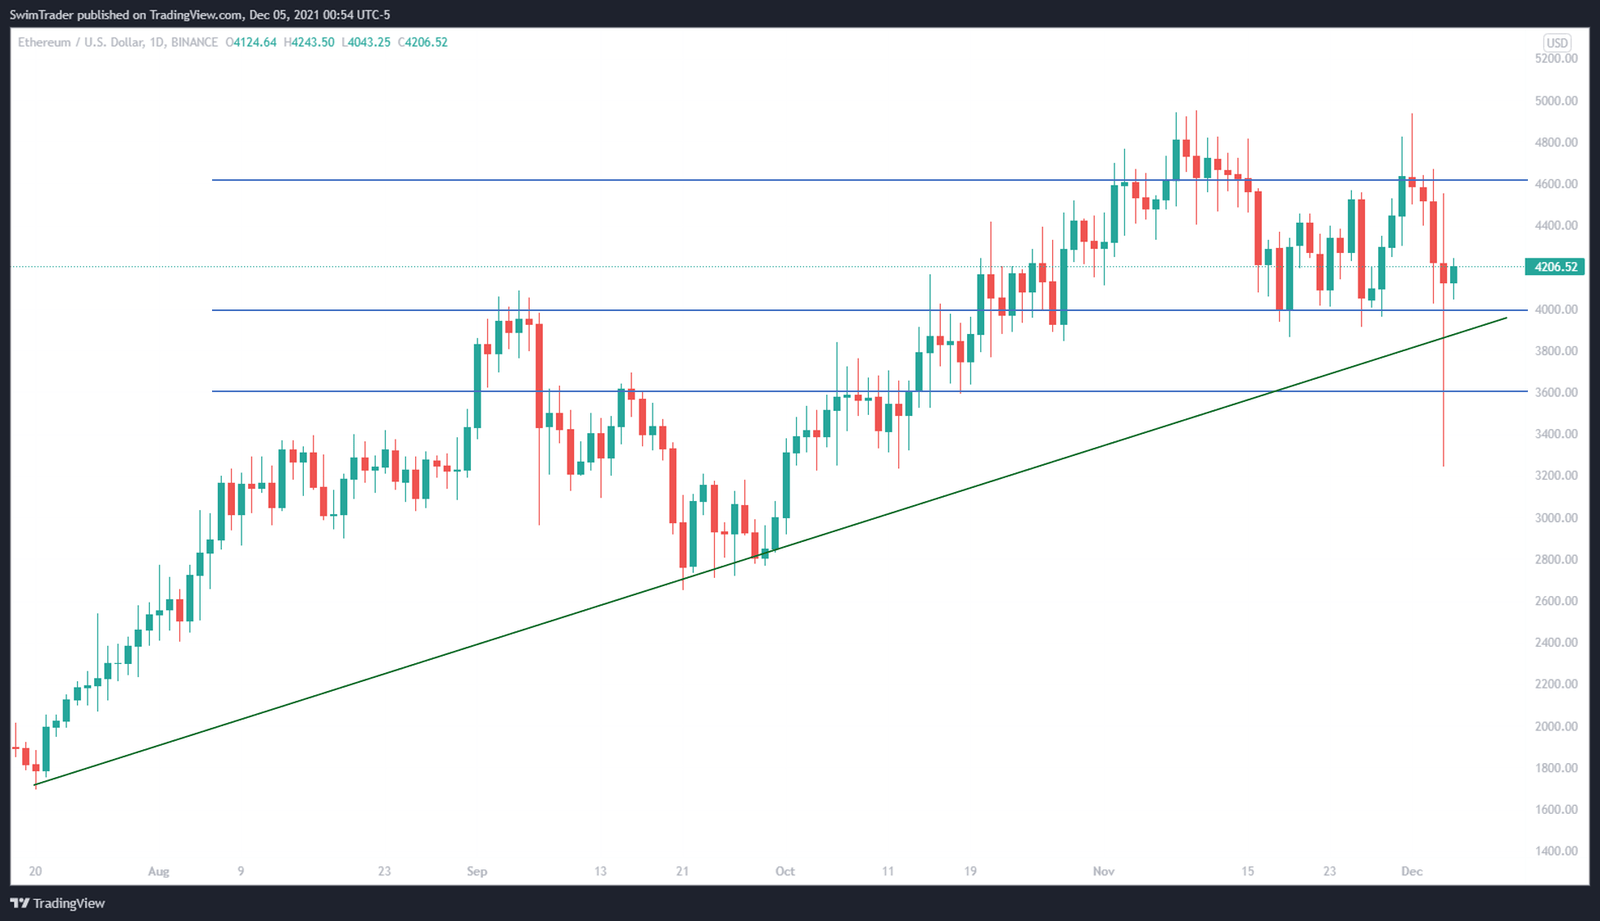
From the chart above, ETH’s mid-term uptrend line is still intact.
With this ease of mind, let’s proceed to have a look at ETH’s internals!
Technically Speaking
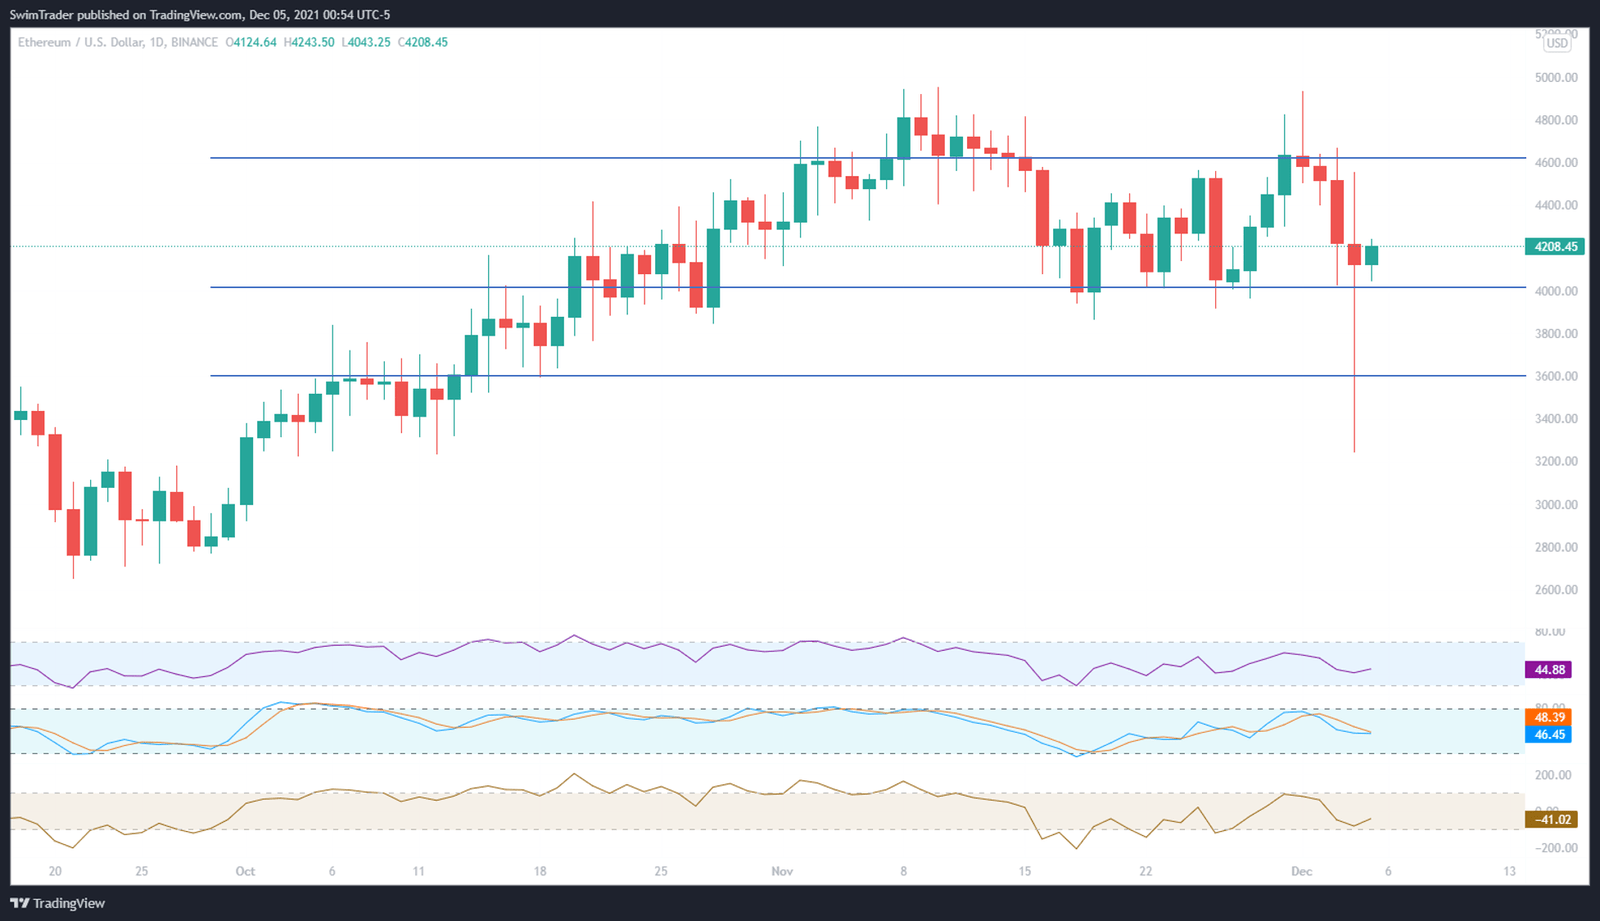
Having included 3 momentum indicators to the chart of ETH, what do you see?
The sudden drop on Sat had brought the values of the 3 momentum indicators nearer to their oversold territory (the white space below the highlighted area).
Is this drop over?
Let’s consider the different scenarios:
- The price of ETH drops to its immediate support zone at $4,000 and remains ranging between $4,000 and $4,600
- The price of ETH falls through its immediate support zone at $4,000 to it’s next support zone at $3,600.
- The price of ETH shoots straight up to $4,000
Which scenario do you think is more likely?
Unlike stocks, the dips and drops in crypto can be pretty steep. What does this mean for your stop loss level to protect your trading capital?
Would you place a tight or wide stop loss if you were trading crypto?
I’d place a wider stop loss to take into account the wider fluctuation. You can set a wider stop loss by using a higher multiple of this indicator.
Doing so would mean a smaller position size to truly protect my capital.

Are you starting out in crypto? You’ll want to head over to Cryptocurrency Explained as I simplify the complex world of crypto just for you!
I have also compared 5 safe crypto platforms which provide high interest rates. Yes, the rates can be 100x or higher than your bank’s savings interest rates. Have a look at it for yourself!
Conclusion
As the world is still gripped by fear in the crypto market, ETH is resilient.
This resiliency could be due to the amount of ETH locked up in staking for ETH 2.0. This will probably play a big role in ETH’s price till ETH 2.0 is finally released.
What is my view on ETH?
I think that Scenario 1 is more possible. If the crypto market recovers, we may even see ETH breaking out of its immediate resistance level of $4,600!
However, there’s a necessary disclaimer I need to state. I’m not a financial advisor, so please treat this article as education.
Here’s What You Can Do To Improve Your Trading Right Now:
#1 Join us in our Facebook Group as we can discuss the various ways of applying this by clicking here
#2 Never miss another market update; get it delivered to you via Telegram by clicking here
#3 Grab a front row seat and discover how you can expand your trading arsenal in our FREE courses (for a limited time only) by clicking here
Trade safe!
