
All news have been on the suspension of trading GME, AMC and the other related stocks which Reddit users have been buying through the various trading platforms such as Robinhood. Congratulations to those who profited from this a once-in-a-lifetime event!
You may have missed the action, but it’s fine as there’re many opportunities which can help you profit consistently and protect your trading capital. Knowing how to interpret the psychology of the market through candlesticks will help you. You can read all the articles on candlesticks by clicking here.
Are you ready to learn more bearish reversal candlestick patterns?
#1 Evening Star
Here’s how the Evening Star bearish reversal candlestick pattern looks like.
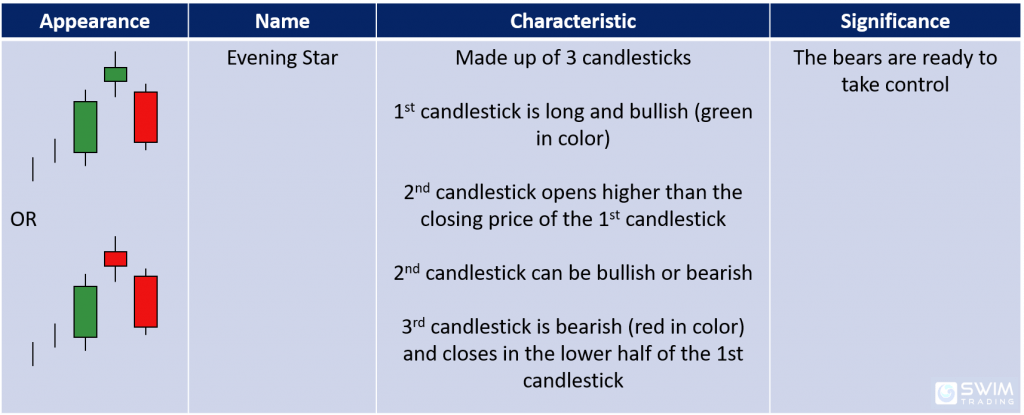
Note that the trend prior has to be up. The 2 vertical lines represent an uptrend.
A gap up on the 2nd candlestick and a gap down on the 3rd candlestick are absolutely necessary too.
Trading Psychology
Let’s have a look at what happened while the Evening Star candlestick pattern formed on the chart of CMG.
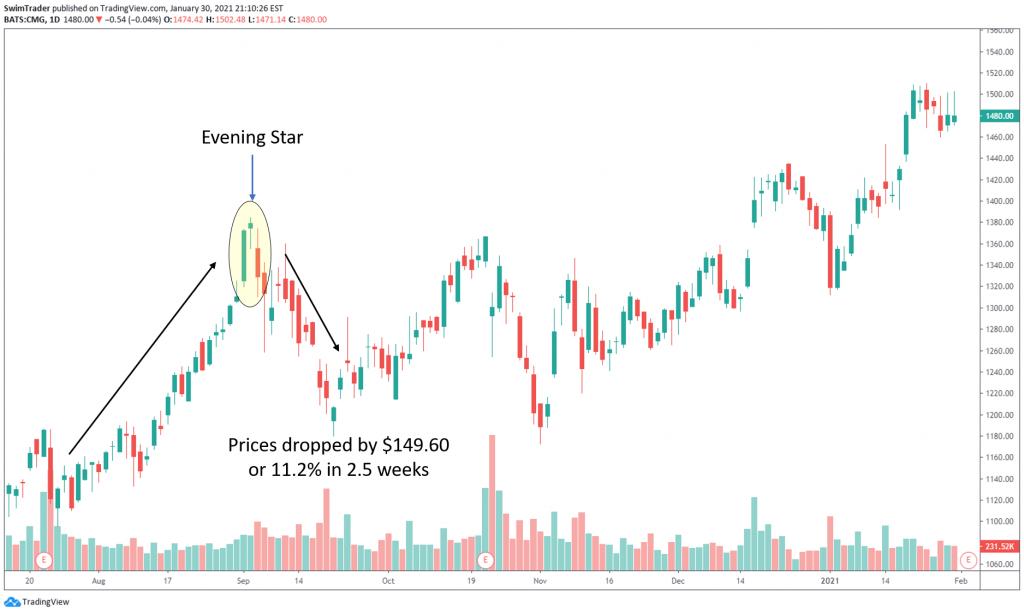
The market participants were extremely optimistic about CMG. This led to a huge rise in price and bullish gap ups before the Evening Star candlestick pattern appeared.
In early Sept 2020, the bulls were super strong, as shown by the gap up and huge green candle. This was to be the start of the formation of the Evening Star candlestick pattern. The bulls were still strong the next day, as there was a gap up. However, as the day went by, bears had crept in to try push prices down. The bulls recovered lost ground to end on a high. This is denoted by the color of the candlestick – green.
The bears didn’t give up. They came in full force the next day and drove prices down by a gap down and throughout the trading session. That session closed below the midpoint of the 1st candlestick, signaling the strength of the bears.
The bears continued to take charge for the next 2.5 weeks and this resulted in a 11.2% (or $149.60) drop in CMG’s share price.
#2 Bearish Abandoned Baby
Let’s have a look at how the Bearish Abandoned Baby bearish reversal candlestick pattern look like.
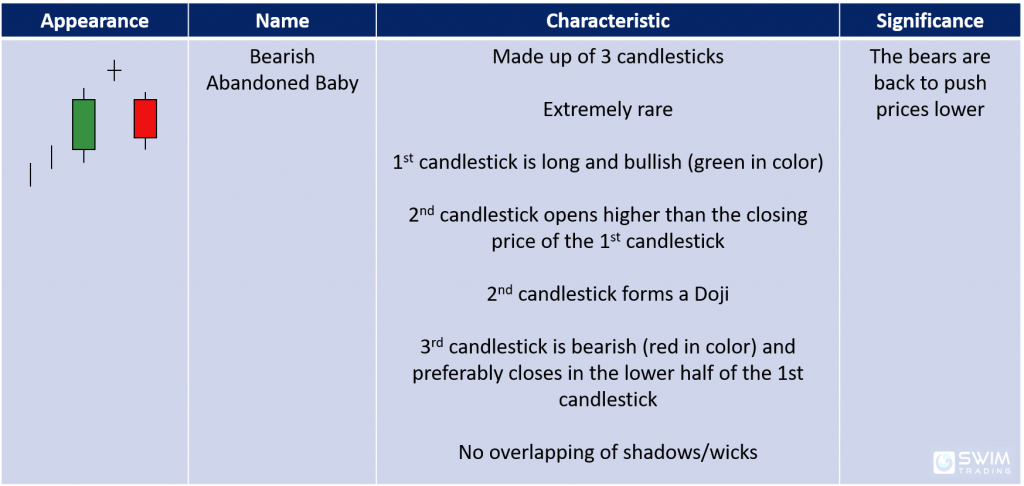
As with the other bearish reversal candlestick patterns, the prior trend has to be up.
A unique feature of the Bearish Abandoned Baby candlestick pattern is that there is no overlapping of shadows. This characteristic makes it extremely rare.
Trading Psychology
The Bearish Abandoned Baby candlestick pattern is so rare that we have to make do with a little overlapping of shadows. This can be spotted on the chart of ADM in late Oct 2020.
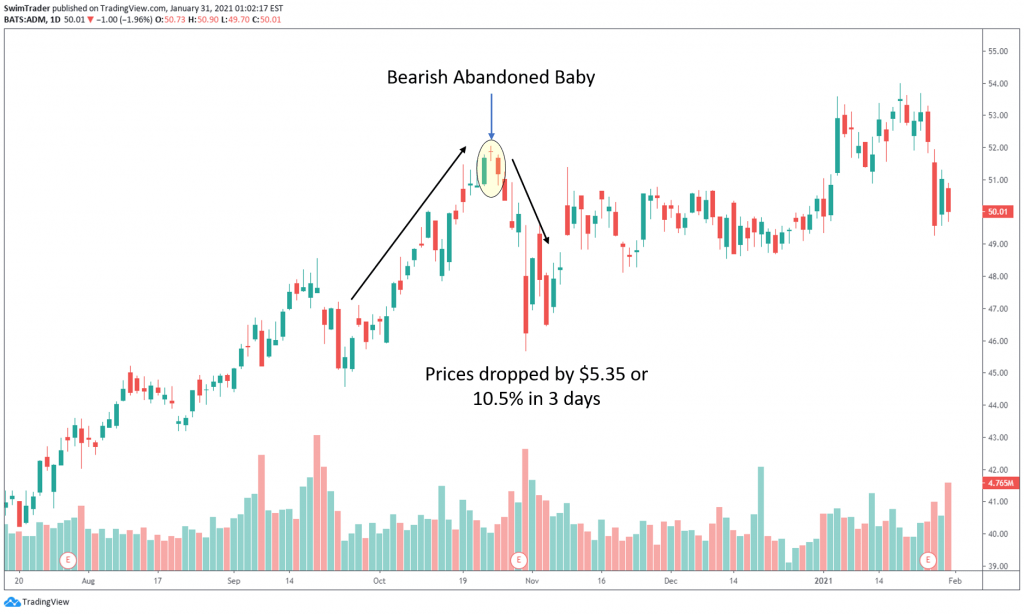
You’d notice that ADM was in an uptrend prior to the formation of the Bearish Abandoned Baby candlestick pattern. This meant that the bulls were in full control and very strong.
On the Doji (2nd candlestick), the bulls were still in control as there’s a gap up. Throughout the day, the bulls and bears had a tough fight, pushing prices up and down. The day ended without a clear winner as the closing price was the same as its opening price.
Things were different the next day. The bears started to stomp in, sending prices lower. This can be inferred from the gap down and the color of the candlestick.
From there on, the bears were in total control, sending prices lower by 10.5% (or $5.35) in 3 short days.
#3 Bearish Tri-star
How does the Bearish Tri-star bearish reversal candlestick pattern look like?

The prior has to be up. There must be a gap between each Doji too.
This is probably the easiest candlestick pattern to spot.
Trading Psychology
The Bearish Tri-star candlestick pattern was spotted on the chart of ZION in late Apr 2020. What were the thoughts of the market participants then?
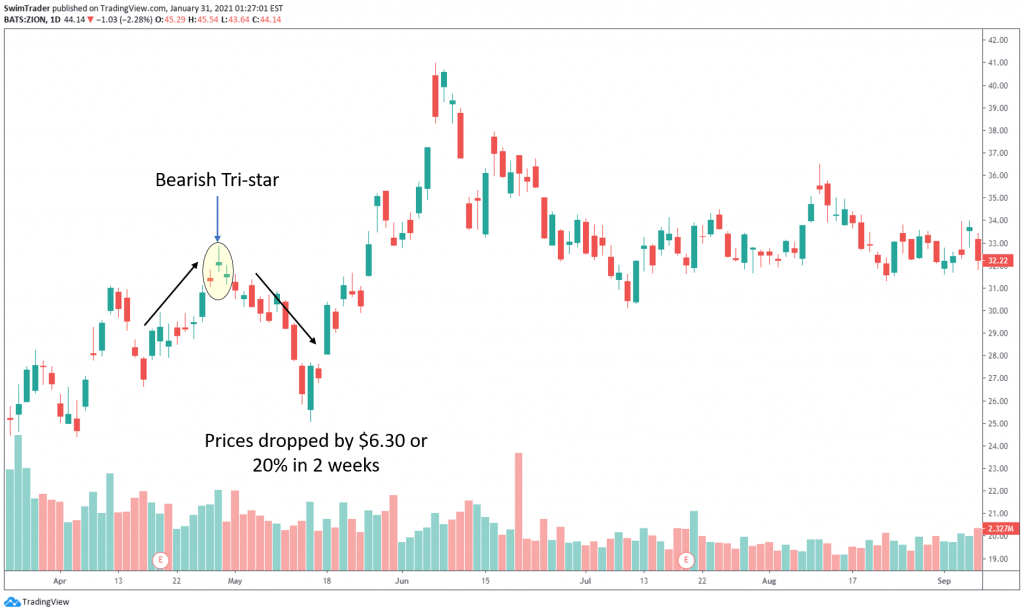
By late Mar 2020, market participants were optimistic and that led to a rally in prices until a drop of 20% in late Apr 2020.
The bulls were in full control when the 1st Doji appeared as it had gapped up. Dojis signal a draw after a tough fight between the bulls and the bears.
The bulls were still in full control when the 2nd Doji appeared. However, they got tired and surrendered at the 3rd Doji as prices had gapped down.
Th bears were back and had successfully lowered prices. This continued for another 2 weeks, resulting in a drop of 20% (or $6.30) in just 2 weeks.
Oh, did you spot the Piercing Pattern at the end of the downtrend in mid May 2020? Learn the characteristics and significance of it here.
2 Things You Must Remember About These Candlestick Patterns
The bearish reversal candlestick patterns discussed today have a common feature – gaps.
Here are 2 pointers that you must remember:
#1 The prior trend must be an uptrend
#2 Gaps must be present and play an important role
Here’s What You Can Do To Improve Your Trading Right Now:
#1 Register for our market outlook webinars by clicking here
#2 Join us in our Facebook Group as we can discuss the various ways of applying this by clicking here
#3 Never miss another market update; get it delivered to you via Telegram by clicking here
#4 Grab a front row seat and discover how you can expand your trading arsenal in our FREE courses (for a limited time only) by clicking here
Trade safe!
