
What do Steve Jobs and Oprah Winfrey have in common?
Apart from being well-known, they’ve skipped a grade in school. They’ve continued to excel after skipping a grade.
But before you skip to the next sentence, do you know how to read candlesticks? You can learn how to read candlesticks here (there’s even a cheat sheet).
Can stocks skip a price point? Yes, they can. Skipping a price point is also known as a gap.
Stocks can gap up (skip a price point or more by jumping upwards), or gap down (skip a price point or more by jumping downwards). Here’s an example on the chart of AAPL:
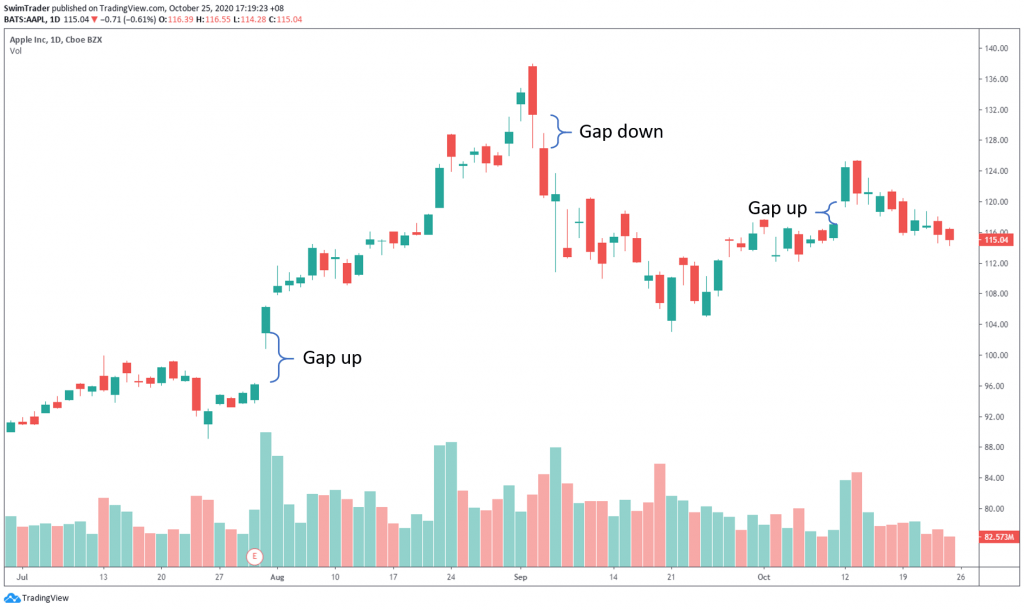 There’re many gaps in the chart of AAPL. Can you spot them all?
Gaps are strong areas of support and resistance. You can learn about the 3 types of gaps and their characteristics here.
Understanding gaps is helpful for the reliable bullish continuation candlestick patterns that I’ll be sharing in this article.
#1 Upside Tasuki Gap
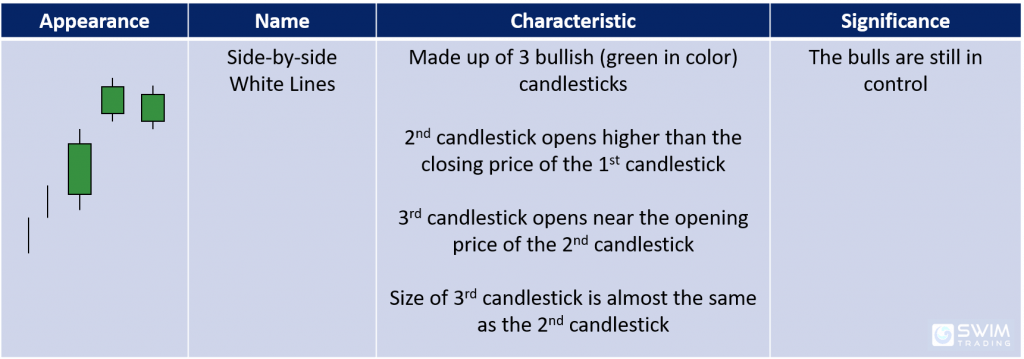
Here’s a table of the characteristics and significance of the Upside Tasuki Gap bullish continuation candlestick pattern.

The 2 vertical lines before the Upside Tasuki Gap pattern represent the range of the previous candles. The previous candles’ color, shape and size are not important. The most important thing is that they are trending up.
Trading Psychology
Here’s a case study of the Upside Tasuki Gap candlestick pattern on the chart of AGCO in late July 2020.
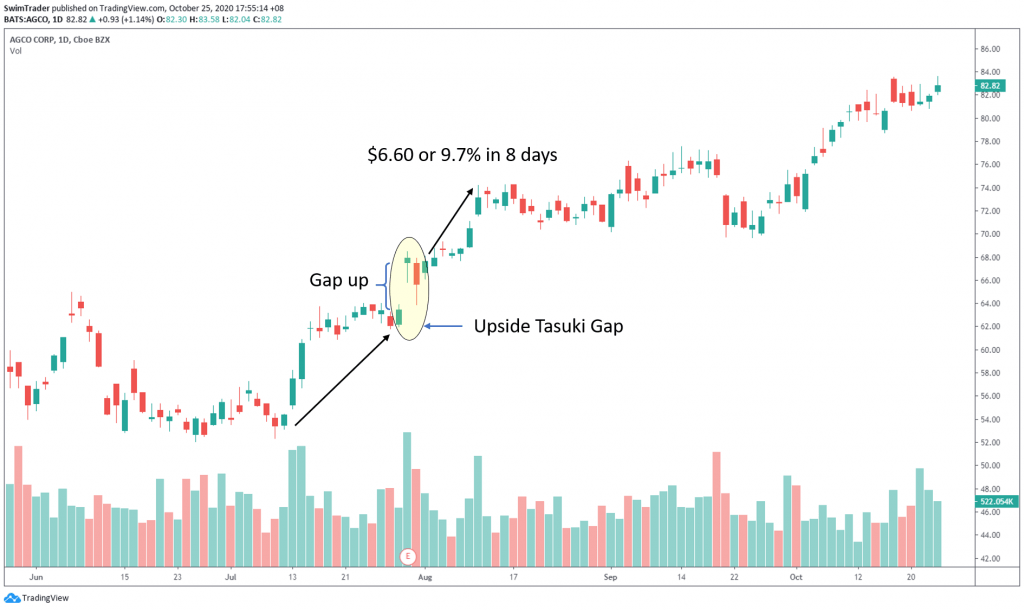
AGCO was and is still in an uptrend. A gap up (due to superior earnings results) appeared.
The bulls were firmly in control until the 3rd candlestick of the Upside Tasuki Gap candlestick pattern. The bears stepped in, as there is a tiny gap down between the closing price of the 2nd candlestick and the opening price of the 3rd candlestick.
Prices in the 3rd candlestick got pushed down, attempting to close the gap between the 1st and 2nd candlesticks. The bulls returned in force to counter the bears and the closing price was still far away from its lowest point.
Subsequently, the bulls continued to push prices up by $6.60 (9.7%) in 8 days.
#2 Side-by-side White Lines
At the 1st glance, the Side-by-side White Lines candlestick pattern looks like the Upside Tasuki Gap candlestick pattern. There’re a couple of small differences which are listed out in the table below.
The 2 vertical lines before the Side-by-side pattern represent the range of the previous candles. The previous candles’ color, shape and size are not important. The most important thing is that they are trending up.
Trading Psychology
This bullish continuation appeared on the chart of GLW in mid-July 2020.
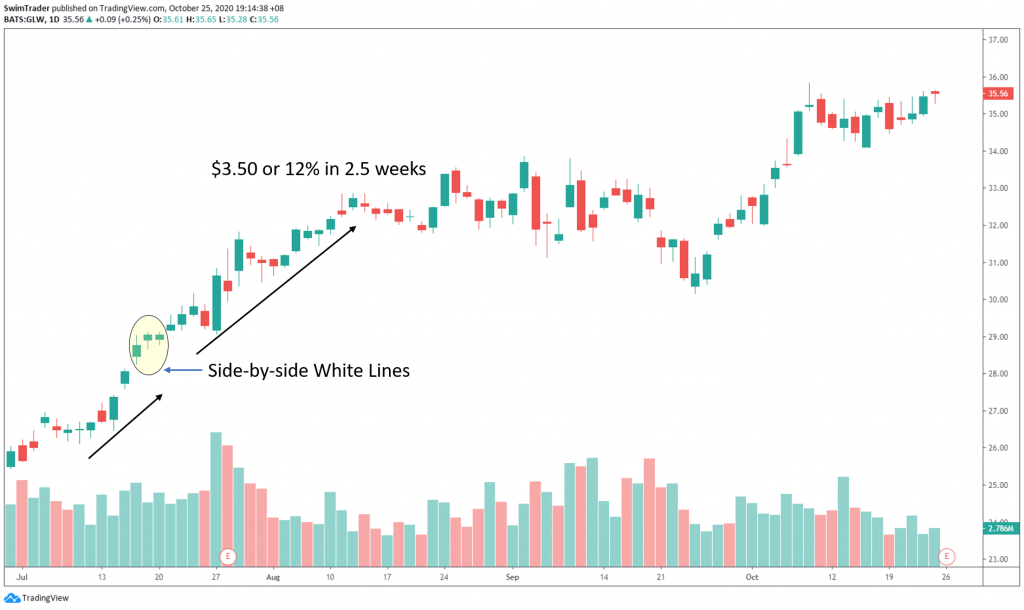
GLW has been in an uptrend prior the formation of the Side-by-side White Lines candlestick pattern. This meant that the bulls were in charge and prices have been increasing.
The bulls were very strong as there had been several gap ups. On the 2nd candlestick of the Side-by-side White Line pattern, prices gapped up. Prices stayed up, forming a bullish candle that’s in green.
Unfortunately, the 3rd candlestick gapped up slightly at the open; it had opened below the closing price of the 2nd candlestick. The bears had stepped in to test the strength of the bulls. The bulls weren’t ready for a long rest as they continued to push prices up to close in the green.
Price continued to rise by $3.50 (12%) in a short 2.5 weeks.
#3 Rising Three Methods
This is an interesting and rare bullish continuation candlestick pattern. Here’s how it should look like.
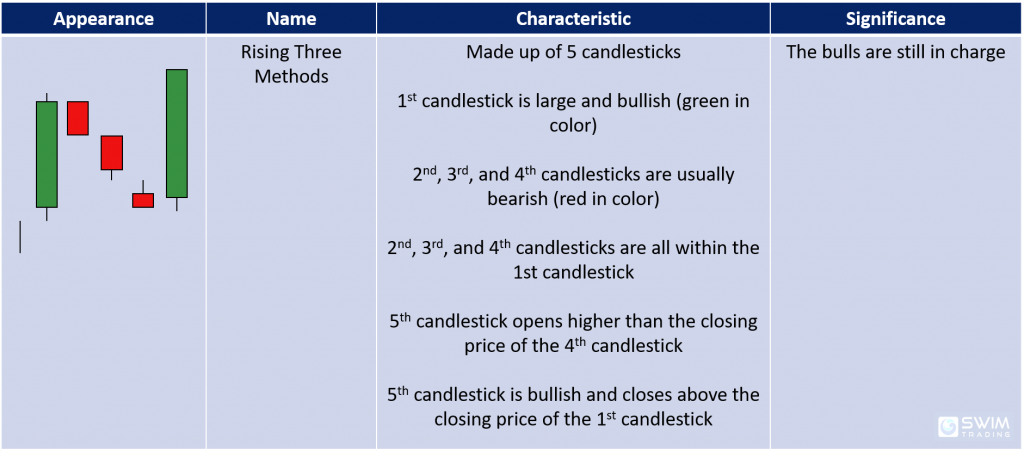
The vertical line before the Rising Three Methods pattern represents the range of the previous candle. The previous candle’s color, shape and size are not important. The most important thing is that it is trending up.
Please note that the 2nd, 3rd, and 4th candlesticks could even be bullish (green in color)! That would be super rare though. A mixture of bullish and bearish (red in color) candlesticks is more common.
Trading Psychology
The Rising Three Methods was spotted on the chart of IAA in late July 2020.

The prices of IAA’s shares were rising steadily. From the size of the bullish (green in color) candlesticks, you can tell that the bulls were extremely strong.
The bulls were in total control in the 1st candlestick. In the next 3 candlesticks, the bears took over. They pushed prices down. However, this doesn’t mean that the bulls were gone for good. This just meant that the bulls were away for a short rest.
The bulls decided to launch a ferocious defense on the 4th candlestick, resulting in a Doji candlestick.
The bears are exhausted and give up. This explains the gap up at the opening price of the 5th candlestick. The bulls wasted no time and prices flew by $9 (20%) in 3.5 weeks!
#4 Mat Hold
The Mat Hold candlestick pattern looks almost identical to the Rising Three Methods candlestick pattern, with 2 exceptions.
The 2nd candlestick must gap up and then close lower, and all the 3 candles in the middle must be bearish.
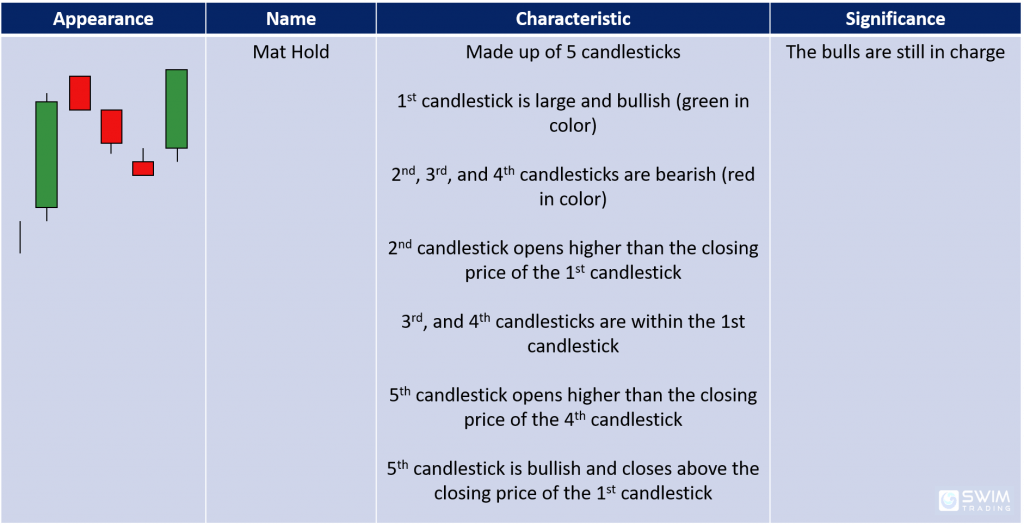
The vertical line before the Mat Hold pattern represents the range of the previous candle. The previous candle’s color, shape and size are not important. The most important thing is that it is trending up.
This is also a very rare bullish continuation candlestick pattern.
Trading Psychology
The Mat Hold candlestick pattern showed up on the chart of NOW in early July 2020. Let’s uncover the psychology to its formation.
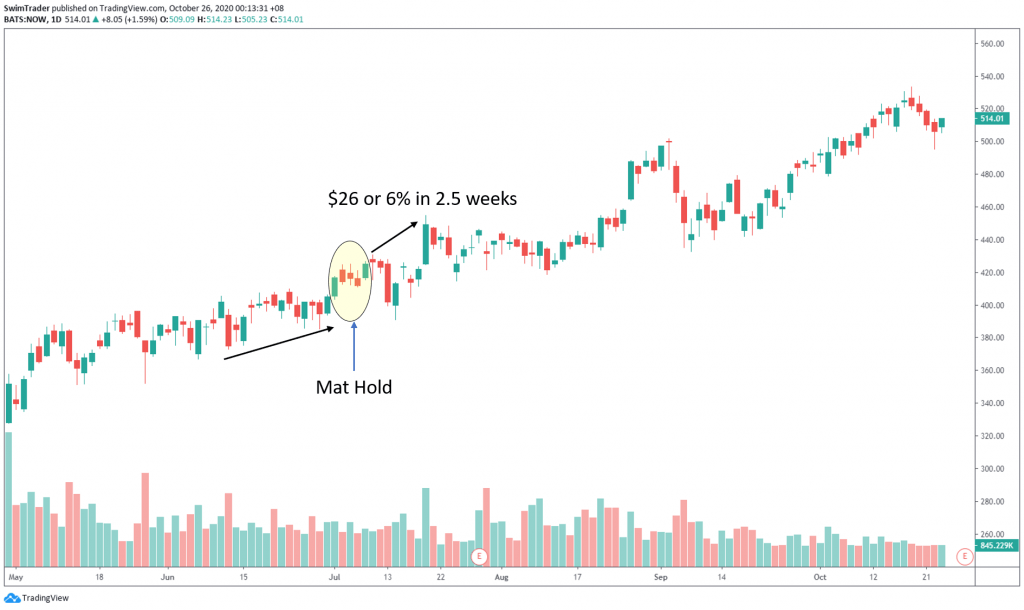
The bulls were inconsistent. This is shown by the large bullish (in green) candlesticks, as well as the presence of large bearish (in red) candlesticks. Overall, the bulls were winning, given that prices were creeping up.
This time, there was a huge thrust up by the bulls. And the bears were unable to press prices down as much as they once did (on the 2nd, 3rd, and 4th candlesticks). The bulls overran the bears on the 5th candlestick, causing a gap up at its opening price.
The bears tried again immediately after the Mat Hold candlestick pattern had been formed. But the bulls returned stronger, and took charge from there. They pushed prices up by $26 (6%) in 2.5 weeks.
#5 Separating Lines
Let’s study the characteristics of the Separating Lines bullish continuation candlestick pattern.
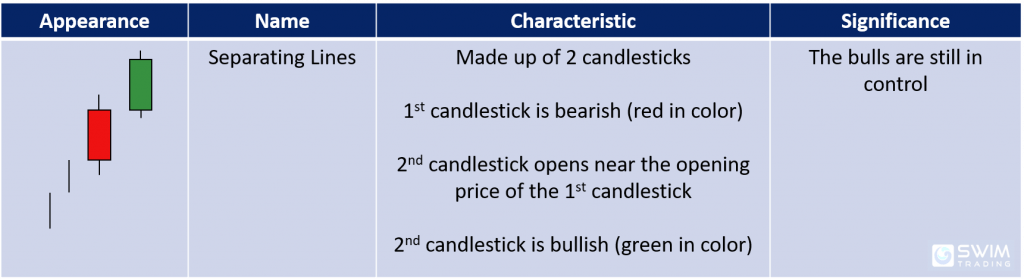
The vertical lines before the Mat Hold pattern represent the range of the previous candles. The previous candles’ color, shape and size are not important. The most important thing is that they are trending up.
Trading Psychology
The Separating Lines candlestick pattern showed up on the chart of NOVA in late July 2020. Let’s dive into its trading psychology.
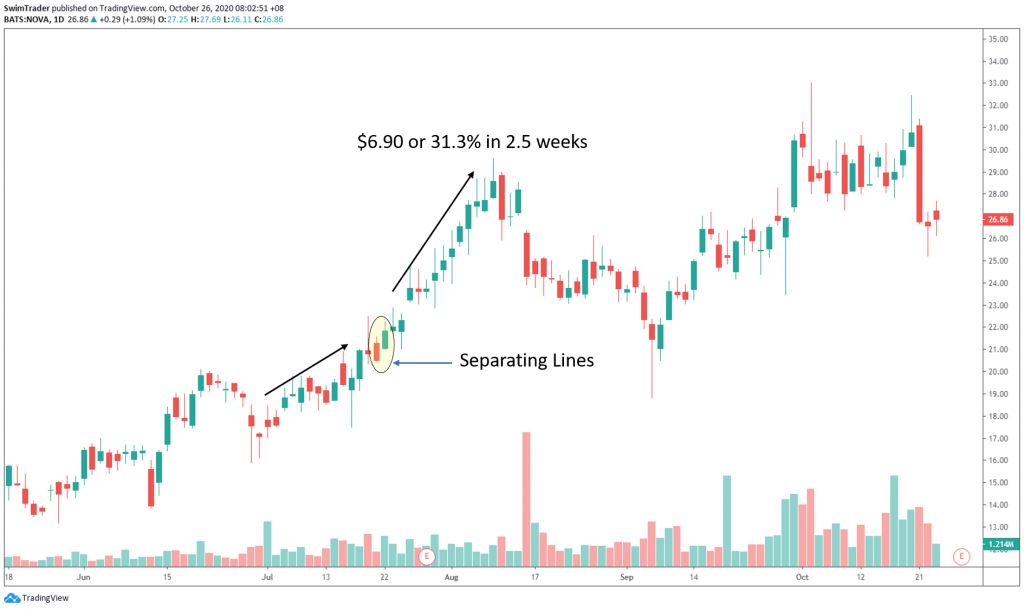
Find this pattern vaguely familiar? It is the opposite of the Deaisen candlestick pattern.
Prices were rising slowly in early July 2020 until the Separating Lines candlestick pattern appeared. The bears overpowered the bulls temporarily, creating a large red candle (1st candlestick). Oh yes, that’s a Marubozu too!
The next day, the bulls were back and took full control right from the opening. Do you see the gap up on the opening price of the 2nd candlestick?
The bulls continued being in the driver’s seat, causing prices to surge by $6.90 (31.3%) in 2.5 weeks.
Congratulations!
You’ve learnt about the characteristics, significance, and the trading psychology behind these 5 bullish continuation patterns:
#1 Upside Tasuki Gap
#2 Side-by-side White Lines
#3 Rising Three Methods
#4 Mat Hold
#5 Separating Lines
Armed with all the bullish reversal patterns (in my previous 4 articles) and bullish continuation patterns, you can be confident in applying them when you are bullish.
As candlesticks patterns don’t work in a vacuum, it is important to know the other important technical tools to increase your chances of success.
Here’s What You Can Do To Improve Your Trading Right Now:
#1 Register for our market outlook webinars by clicking here
#2 Join us in our Facebook Group as we can discuss the various ways of applying this by clicking here
#3 Never miss another market update; get it delivered to you via Telegram by clicking here
#4 Grab a front row seat and discover how you can expand your trading arsenal in our FREE courses (for a limited time only) by clicking here
Trade safe!
