
Don’t you like buying stocks on the cheap and watch it rise? Don’t you love it when you sell them at the peak?
The Relative Strength Index (RSI) can help you spot possible turning points which lead to good entries and exits.
RSI Explained
What is it?
RSI is a momentum oscillator. It measures price momentum and oscillates between 0 to 100.
The common period used is 14.
It can be used for stocks, forex, cryptocurrency, and commodities.
What is it used for?
#1 Spot divergence to provide timely entries and exits
#2 Spot possible turning points
#3 Identify strength and weakness of the underlying
Geek Speak (skip this section if Math gets you dizzy)
As mentioned, RSI tells you the price momentum of the underlying. If prices are closing higher on average, there’s an upward momentum.
You’ll need to calculate the Relative Strength (RS) first.
Here’s how you can calculate it:


Here’s an example using Excel:

Understanding what RSI is about, you’re ready to discover the 3 powerful applications of the RSI.
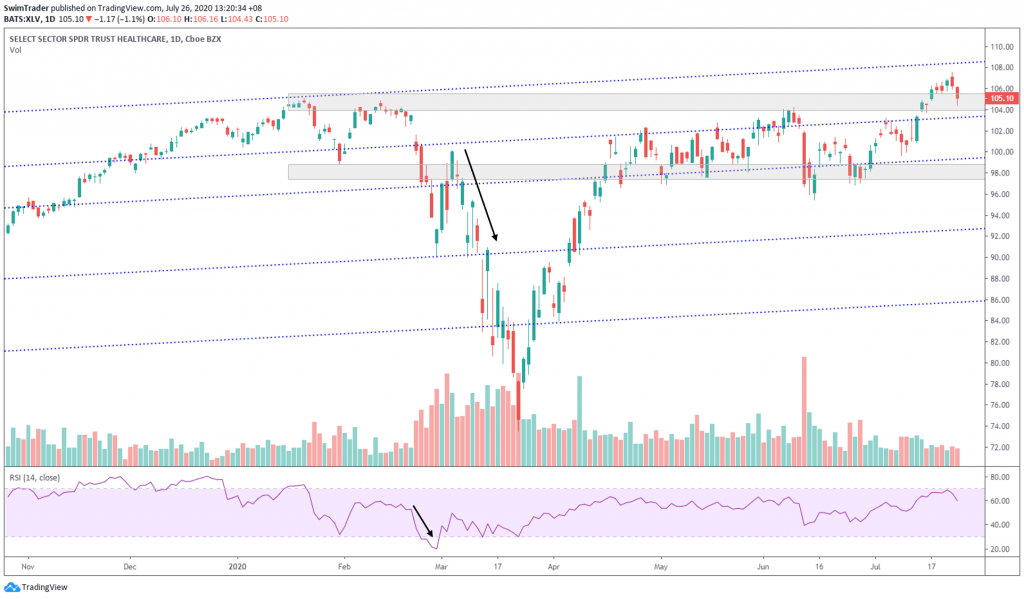
I will use the chart of Healthcare ETF (XLV) throughout this article.
3 Powerful RSI Applications You Must Know
#1 Spot divergence to provide timely entries and exits

When prices are making new highs while the RSI isn’t, that’s a divergence. It is a red flag. See how the 1st 3 divergences warned of the upcoming crash?
The 4th divergence flagged out the failing strength of the bear market, suggesting that prices will be rising soon.
What should you do when you see a divergence? Stay out of the market, tighten your stop loss, or even exit the market.
#2 Spot possible turning points

There are 2 levels that the RSI marks out – overbought (>70) and oversold (<30).
As the names of the 2 levels suggest, if the RSI reading is >70 (overbought), prices are highly inflated and should drop soon. When the RSI reading is <30 (oversold), prices have been sold to the bottom and should rise soon.
By adding support and resistance and trendlines, you can spot turning points more accurately.
#3 Identify strength and weakness of the underlying

In an uptrend, an increase in the RSI reading signifies an increase in bullish momentum. It is a good time to go Long.
A decrease in the RSI reading signifies that the bullish momentum is waning. This is a divergence; stay out of the market, tighten your stop loss or even close your positions.
In a downtrend, an increase in the RSI reading indicates a decrease in bearish momentum. This is a divergence; stay out of the market, tighten your stop loss or even close your positions.
A decrease in the RSI reading signifies an increase in bearish momentum. It is a good time to go Short.
As always, wait for price confirmation. It pays to be slightly late to the party where there are more guests.
Things You Must Remember
#1 Look out for divergence to increase your trading edge
#2 Know where the overbought and oversold levels are to spot turning points
#3 Include support and resistance and trendlines to increase your chances of success
#4 Buy when the RSI reading is increasing in a bull market; Sell short when the RSI reading is decreasing in a bear market
#5 Always wait for confirmation (ie. don’t buy just because the RSI reading is in the oversold territory)
Here’s What You Can Do To Improve Your Trading Right Now:
#1 Register for our market outlook webinars by clicking here
#2 Join us in our Facebook Group as we can discuss the various ways of applying this by clicking here
#3 Never miss another market update; get it delivered to you via Telegram by clicking here
#4 Grab a front row seat and discover how you can expand your trading arsenal in our FREE courses (for a limited time only) by clicking here
Trade safe!
