
Location, location, location. It is one of the most important factors for any piece of real estate. You don’t want to live next to an open sewage area where the air is foul and pests roam freely. You’ll not want to open a ballet studio next to a drumming studio too.
Prime locations command higher prices and rents. This is similar in the stock market.
The right candlestick pattern at the right place leads to an increase demand, resulting in rising prices. Hence, you’ll want to buy on the breakout when you see any of these 6 candlestick patterns. But what is a breakout?
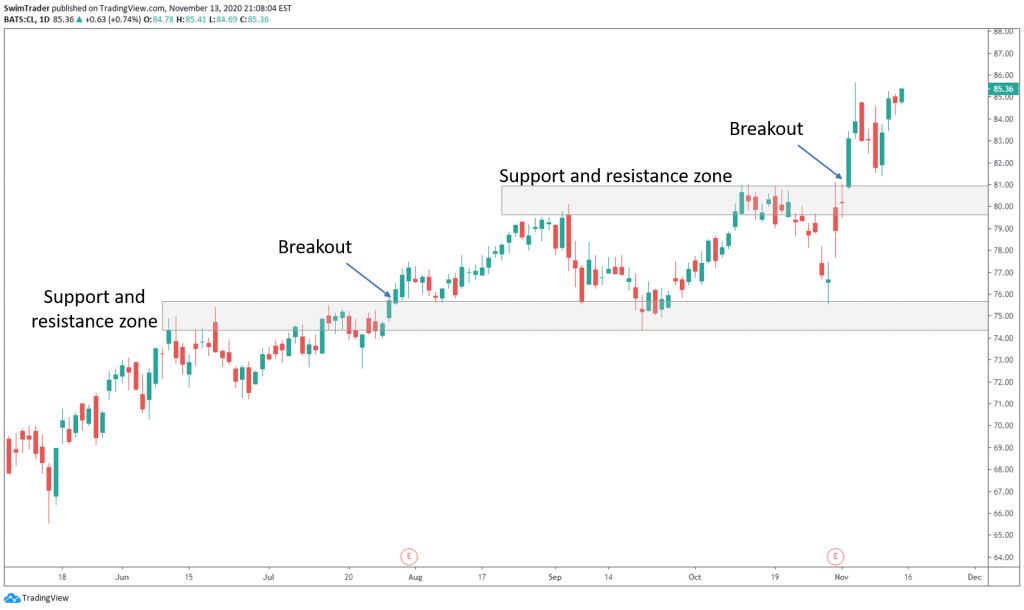
A breakout is when prices burst through a support and resistance zone. Here’s an example on the chart of CL.
Knowing this, let’s uncover these 6 candlestick patterns which you will want to buy on the breakout.
#1 Bullish Harami

Since the Bullish Harami candlestick pattern must appear in a consolidation, it is wise to sit out and wait for a breakout. A bullish breakout will tell you that the bulls are stronger, overpowering the bears.
This is shown in the chart of NOW in the next section below.
Trading Psychology
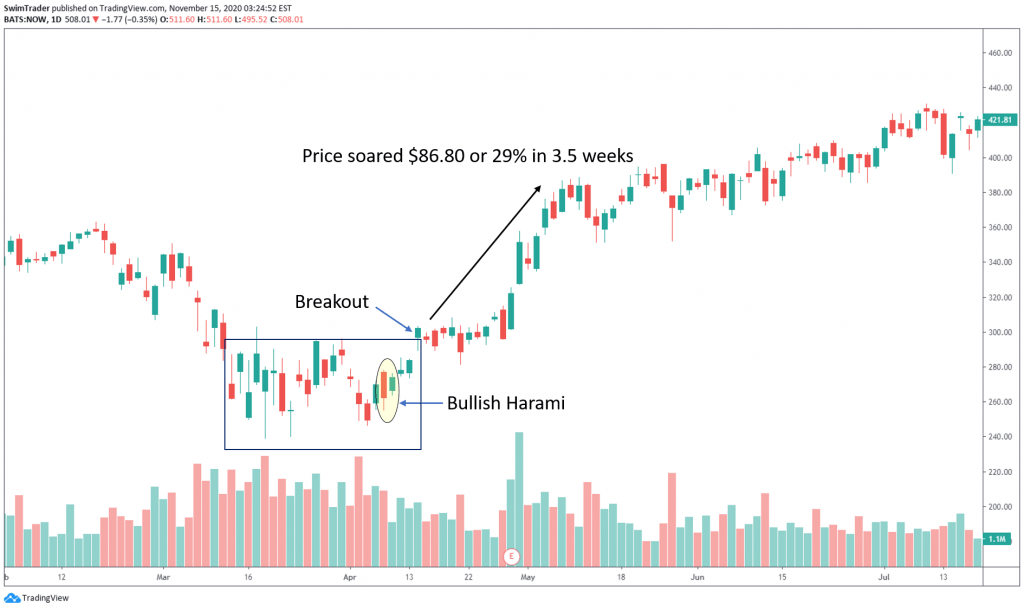
After a period of price decline, prices consolidated (shown in the rectangle).
It is in the consolidation that the Bullish Harami candlestick pattern appears. This suggest that a bullish move is about to happen. Why?
The 1st candle is ultra bearish as it has a long and red body. The 2nd candlestick gapped up at the opening and managed to stay green. This is a clue that the bulls are starting to find their footing and may be ready to challenge the bears.
The bulls eventually succeeded when a breakout occurred in mid-Apr 2020. The bulls pushed prices above its resistance zone of $300. This breakout is confirmed by high volume. Volume brings clues which will improve your trading results.
This mighty breakout led to a massive bull run which saw prices soar $86.80 (or 29%) in 3.5 weeks!
#2 Bearish Harami
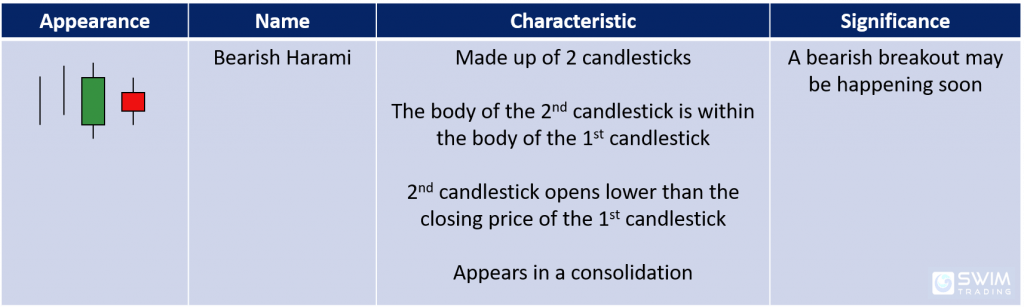
The order of the bullish and bearish candlesticks in the Bearish Harami candlestick pattern is opposite than the Bullish Harami’s.
While the prior trend to the Bearish Harami pattern is an uptrend as opposed to the that of the Bullish Harami pattern, they share the same significance.
Wait for a bullish breakout before entering your position. Let’s see how this played out in the chart of A.
Trading Psychology
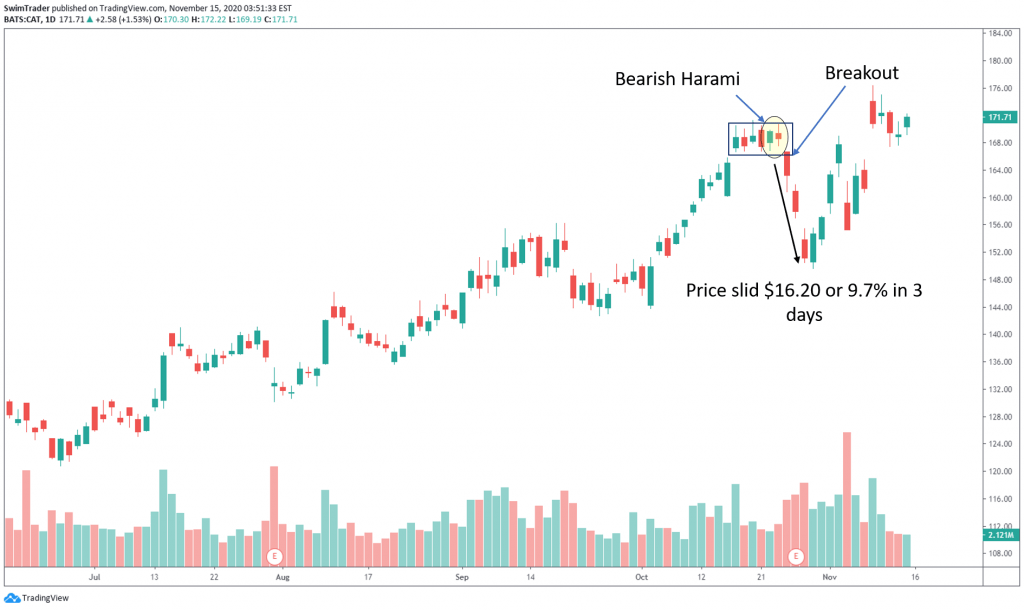
CAT has been enjoying an uptrend before consolidating.
While in consolidation, the Bearish Harami candlestick pattern appeared.
The 1st candlestick is bullish. The 2nd candlestick gapped down at the opening. The bears had stepped in but the bulls continued to hold their ground all the time, until the bears pressed prices down to close the day lower.
This is an indication that the bears are strong challengers. They overpowered the bulls and prices tumbled $16.20 (or 9.7%) in 3 short days!
Volume was high on the breakout, further confirming this breakout.
#3 Bullish Doji
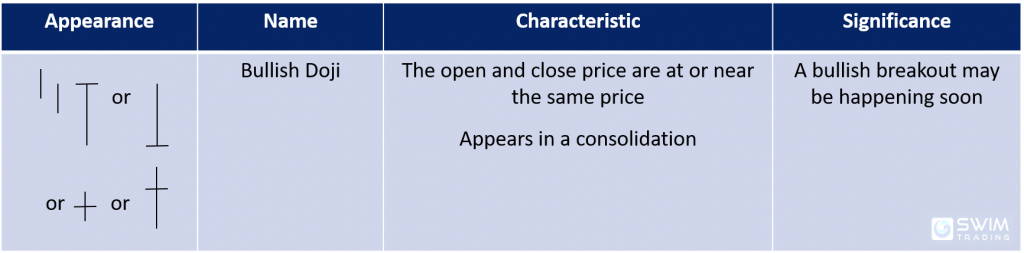
This is another candlestick pattern which signifies a tie between the bulls and bears. You’ll have to wait for a bullish breakout before going Long to minimize your opportunity costs.
Let’s unwrap the psychology behind the Bullish Doji that had appeared on the chart of TEL in the next section.
Trading Psychology

TEL had been on the decline from early June 2020. Prices consolidated for slightly more than a month before 2 Bullish Dojis appeared.
As the 1st Doji was formed, the bears were in full control (demonstrated by the gap down on its opening). But the bulls did their best to push prices back up. They won marginally that day.
The next day, prices gapped up at the opening. The bulls continued to push prices higher and the bears stepped in. The bears won by a little that day. However, prices were up overall.
That was a clue that the bulls may be back to push prices out of the consolidation.
The bulls continued to fight the bears ferociously and a breakout finally happened in mid-July 2020. The bulls took over and prices soared by $13 or 15.5% in 1 month.
As with every breakout, it is ideal to see higher volume at the breakout.
#4 Bearish Doji

The Bearish Doji looks identical as the Bullish Doji. The key difference is the location of the Doji appearing.
The Bearish Doji appears in an uptrend while the Bullish Doji appears in a downtrend.
You’ll want to short-sell when you see a Bearish Doji candlestick pattern. “Wait a minute. What’s short-selling?”
Going Long means buying a stock in anticipation in a rise in its price. Going Short (or short-selling) means selling a stock which you don’t own in anticipation in a drop in its price. This is a special arrangement between you and your broker, so check if your broker allows short-selling.
Trading Psychology
The Bearish Doji appeared on the chart of GLW in late Oct 2020 at the end of a consolidation.
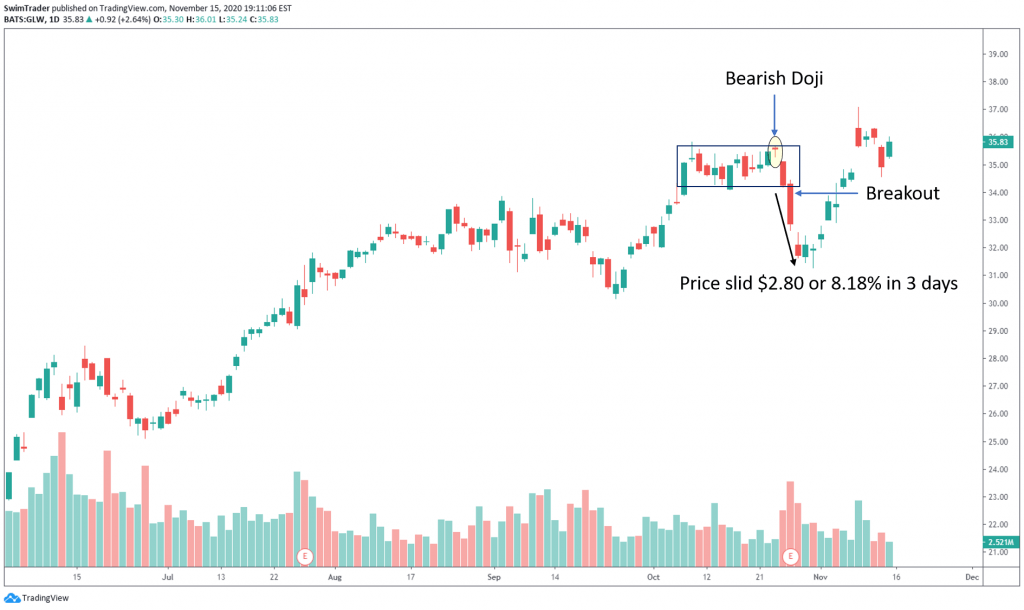
On the day the Bearish Doji appeared, the bulls were in total control. There was a gap up in its opening price. Over the day, the bulls managed to push prices up.
However, the bullish momentum faded away as bears forced prices lower. The closing price for that day was a little below its opening price, leaving a long lower wick. Is this bullish or bearish? It is neutral a breakout would be needed.
Soon after, there was a breakout with high volume. This is a strong confirmation that the bears are fully in charge. The share price of GLW dropped by $2.80 or a whopping 8.18% in just 3 days!
#5 Bullish Rickshawman
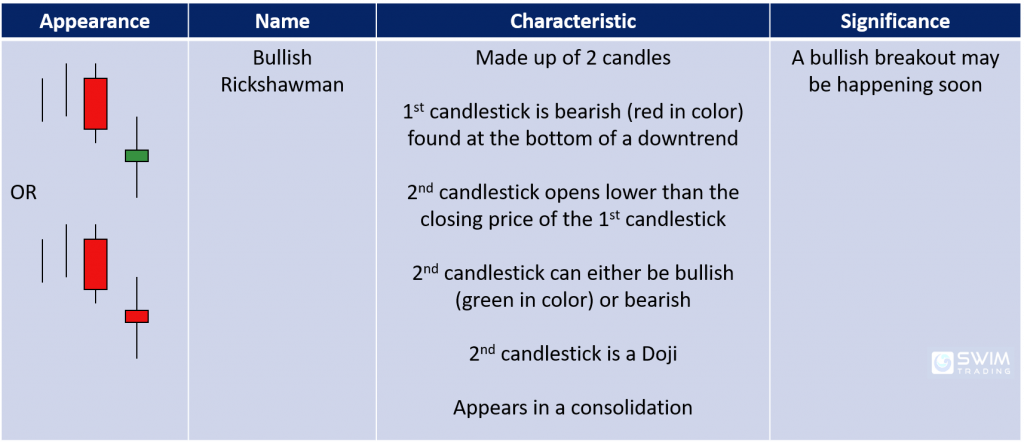
The Bullish Rickshawman is found at the end of a consolidation. Let’s discover the psychology behind the formation of this candlestick pattern in the next section.
Trading Psychology
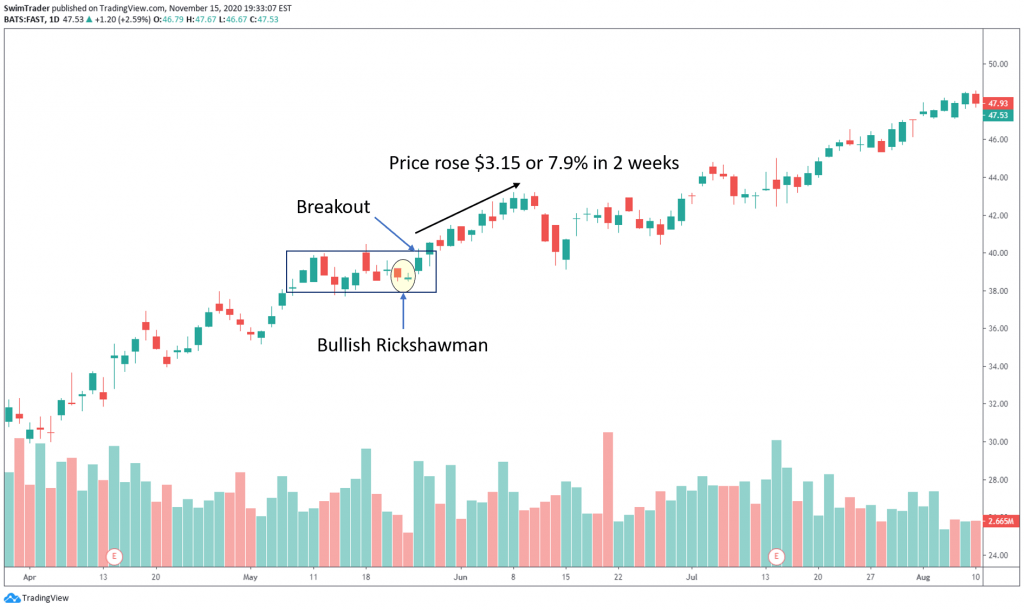
The Bullish Rickshawman pattern was spotted on the chart of FAST in late May 2020.
At first glance, you’d think that the share price of FAST will fall.
However, it is the complete opposite. At the 1st candlestick, the bears were very strong. They pushed prices lower and finished the day lower.
Bearish momentum was still present in the 2nd candlestick as it opened lower. The bears pressed prices down, but this wasn’t without a huge fight. The bulls entered and pushed prices up and above the opening price. As the day went, the bulls won by a tiny margin. The closing price was just slightly higher than its opening.
The next day, a breakout occurred. This took place with high volume which added conviction. The share price of FAST shot up by $3.15 or 7.9% in just 2 weeks!
#6 Bearish Rickshawman
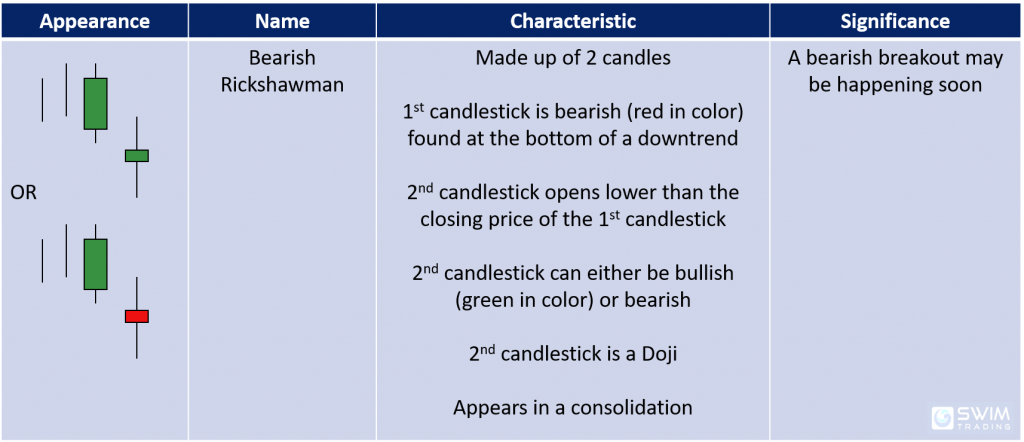
You may find a quick shorting opportunity when the Bearish Rickshawman candlestick pattern appears in a consolidation.
Let’s see why!
Trading Psychology
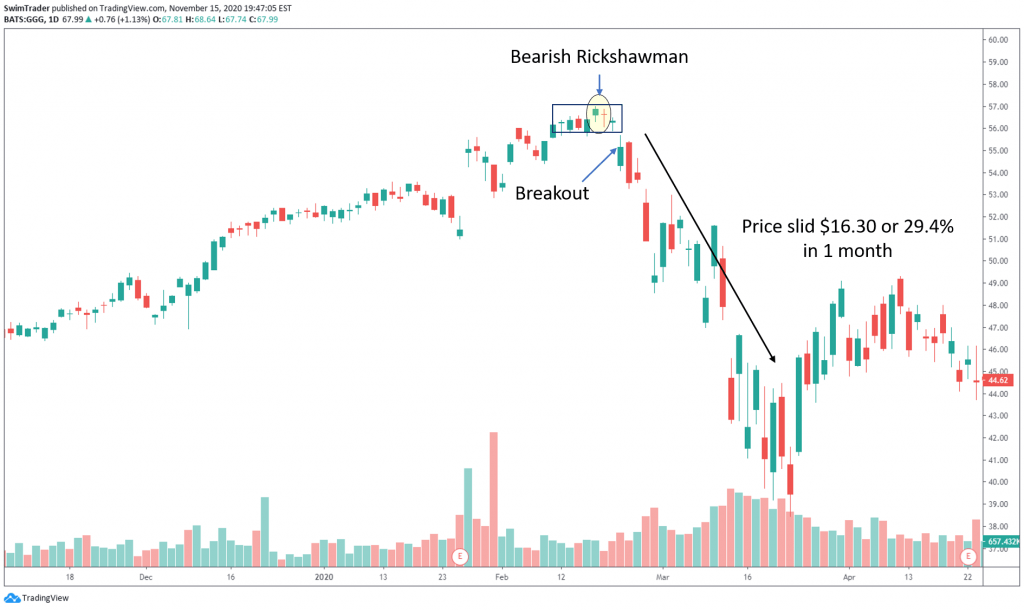
The Bearish Rickshawman candlestick pattern showed up in mid-Feb 2020. Shortly after. the share price of GLW collapsed by $16.30 or 29.4% in a month!
The 1st candlestick is bullish. The bulls are still in full control.
This bullishness faded as the 2nd candlestick gapped down at the opening. The bears forced prices down and the closing price was just slightly lower than the opening level. This suggests that the bears are overpowering the bulls.
With the bears back in the scene, you’ll want to watch for a breakout. The breakout came 2 days later and prices collapsed by 29.4%!
Candlestick Patterns Recap
The location of these 6 candlestick patterns is crucial in determining success – they must be seen at the top or bottom of a trend. Wait for a breakout to be coupled with high volume which adds a layer of confirmation.
Here are the names of the 6 candlesticks patterns which you have learnt today:
#1 Bullish Harami
#2 Bearish Harami
#3 Bullish Doji
#4 Bearish Doji
#5 Bullish Rickshawman
#6 Bearish Rickshawman
Here’s What You Can Do To Improve Your Trading Right Now:
#1 Register for our market outlook webinars by clicking here
#2 Join us in our Facebook Group as we can discuss the various ways of applying this by clicking here
#3 Never miss another market update; get it delivered to you via Telegram by clicking here
#4 Grab a front row seat and discover how you can expand your trading arsenal in our FREE courses (for a limited time only) by clicking here
Trade safe!
