
Crypto is back in the news. This is after the price of Bitcoin has broken out of its long term resistance of $42,000.
As most of the top 100 cryptocurrencies are turning bullish once again, you are keen to invest in the cryptocurrency market. Before you invest your hard-earned money into crypto (short form for cryptocurrency), it’s a good idea to have a strong understanding of crypto.

And if you need help with some of the crypto terms, you can refer to our glossary to help you along.
Are you ready? Let’s begin!
#1 Number Of Active Addresses
The number of active Bitcoin addresses matters. This can give you a hint if the current price of Bitcoin is sustainable.

The black line indicates the number of Bitcoin addresses which has 0.1 BTC or more.
The blue line indicates the number of Bitcoin addresses which has 1 BTC or more.
The green line indicates the number of Bitcoin addresses which has 100 BTC or more.
The orange line indicates the number of Bitcoin addresses which has 1,000 BTC or more.
What can you tell from the chart above?
Who’s driving up the price of BTC? Is it the whales or retail investors?
#2 Price Action
We now know that the rise in price of Bitcoin is predominately caused by the increase in demand from retail investors, let’s have a look at Bitcoin’s chart. What can we uncover?

From the chart above, we can tell that Bitcoin is in an uptrend with higher highs and higher lows.
With long term support and resistance drawn, we can see why analysts were eager to see the price of Bitcoin break above the zone of $40,000 to $42,000.
Also on the chart are trendlines. Trendlines act as speed lines and support and resistance. You can read about it here.
Now, I’ll be adding 3 momentum indicators to help me have an X-ray vision into Bitcoin.
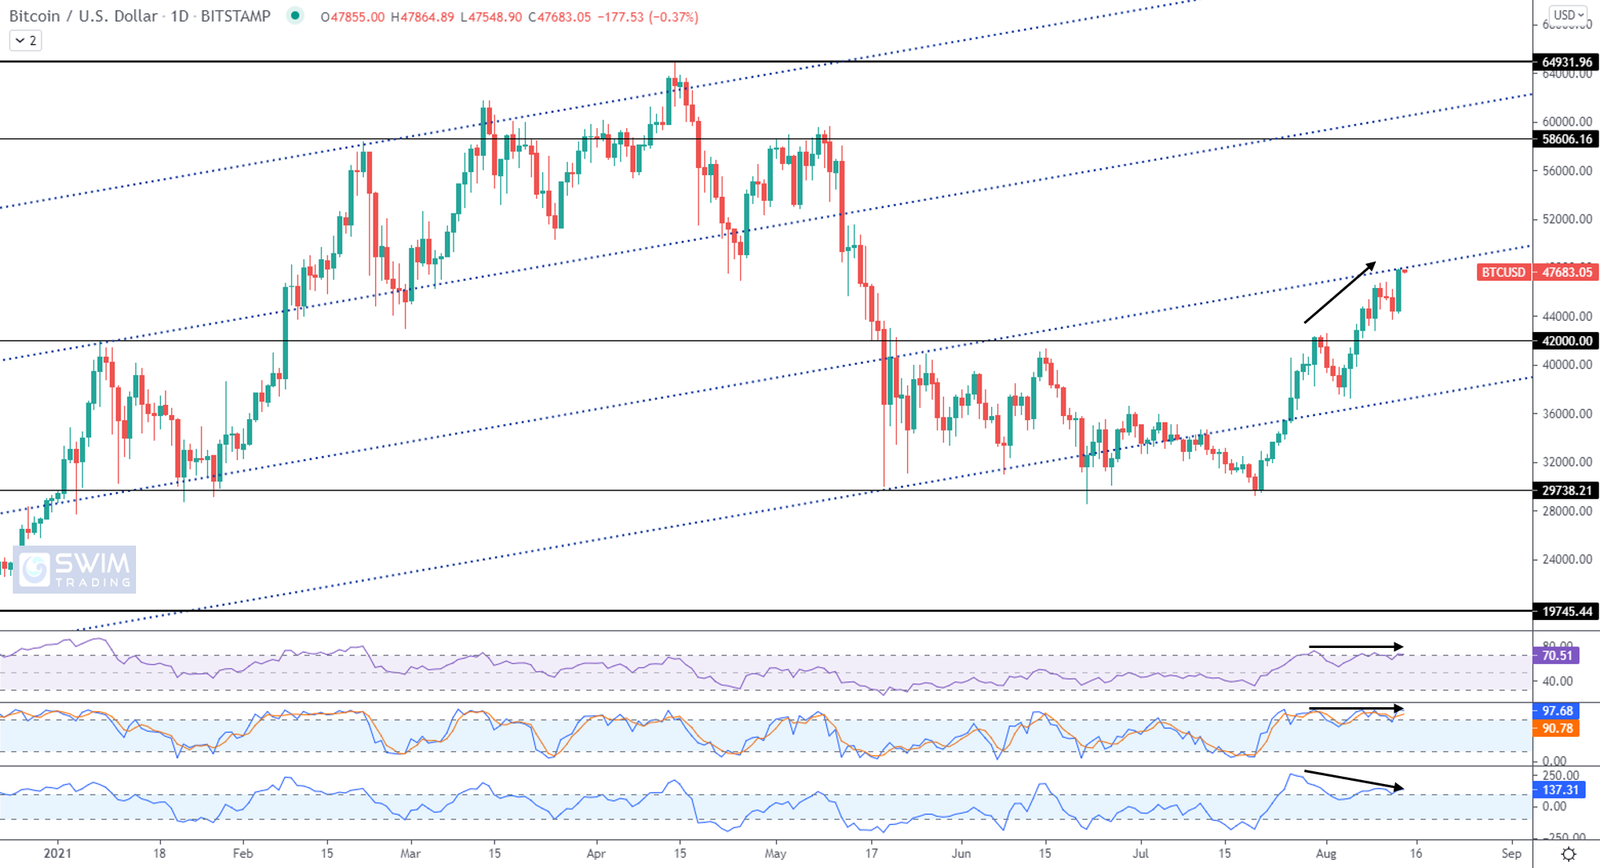
Do you see a divergence between price and the momentum indicators?
This divergence suggests that the momentum of Bitcoin is waning. Prices may fall in the near future. Will it be a small retracement or a crash? I wish I could tell!
#3 Key Price Levels
With all that said, what can you do as a long term crypto investor?
Wait for a big pullback.
As with crypto, you can expect sharp pullbacks. Pullbacks of 15% to 30% are common.

The above is the weekly chart of Bitcoin. If the price of Bitcoin begins pulling back real soon, it could potentially retrace to the $40,000 to $42,000 zone. This is because we can see a demand zone (aka support zone) between $40,000 and $42,000.
Hence, the zone between $40,000 and $42,000 is worth the wait before you add Bitcoin into your bag and hodl (hold on for dear life).
Can the price of Bitcoin zoom up to its resistance area of $58,000 before retracing? Yes. But if you chase the price of Bitcoin, your heart may be broken when a retracement finally takes place.
4 Things You Must Remember

#1 It is important to know who is moving prices – retail investors or whales
#2 Divergence is a sign on weakness in momentum
#3 Trendlines act as speed lines and support and resistance
#4 Support and resistance work well on crypto
Here’s What You Can Do To Improve Your Trading Right Now:
#1 Register for our market outlook webinars by clicking here
#2 Join us in our Facebook Group as we can discuss the various ways of applying this by clicking here
#3 Never miss another market update; get it delivered to you via Telegram by clicking here
#4 Grab a front row seat and discover how you can expand your trading arsenal in our FREE courses (for a limited time only) by clicking here
Enjoy your crypto ride!
