
You bought Visa (V). It flew towards your profit target level, and you are within an inch of reaching it. Suddenly, the price of Visa dived and your stop loss got triggered.
You are horrified because you had lost money when you could’ve made money. You regret not moving your stop loss as Visa was rising.
If only you had moved your stop loss level to breakeven or to lock in minimal profits! Is there an indicator that can help you?
Enter the Average True Range (ATR) indicator.
ATR Explained
What is it?
The ATR indicator measures volatility. It tells you the average price range of a given period (which is usually 14-period).
How can you use it?
Since ATR tells of the stock’s volatility, it is helpful in 3 main ways:
#1 Setting a hard stop loss level
#2 Trailing your stop loss level
#3 Setting a realistic price target
Using the ATR indicator in these 3 ways increases your probability of making money. I will go into greater details in the section “3 Magical Ways You Can Use The ATR Indicator”.
Geek Speak (skip this section if Math gets you dizzy)
ATR was developed by J. Welles Wilder Jr for commodities trading. It can also be applied to stocks and forex.
Wilder Jr calculated the ATR in 3 ways which is shown in the diagram below.

The method which brings the largest absolute value is taken as the true range.
Calculation of ATR
To get the 1st true range, subtract the High and Low of the 1st candle.
Subsequently, calculate the range by using the 3 methods (shown in the diagram above) and use the one with the largest absolute value.
Average out the true range of the past 14 candles to get the 14-period ATR.
(Note: If you use a 14-period ATR on a daily chart, the ATR value is for the past 14 days).
Current ATR = [(Previous ATR x 13) + Current True Range] / 14
- Multiply the previous 14-day ATR by 13
- Add the most recent day’s true range
- Divide the total by 14
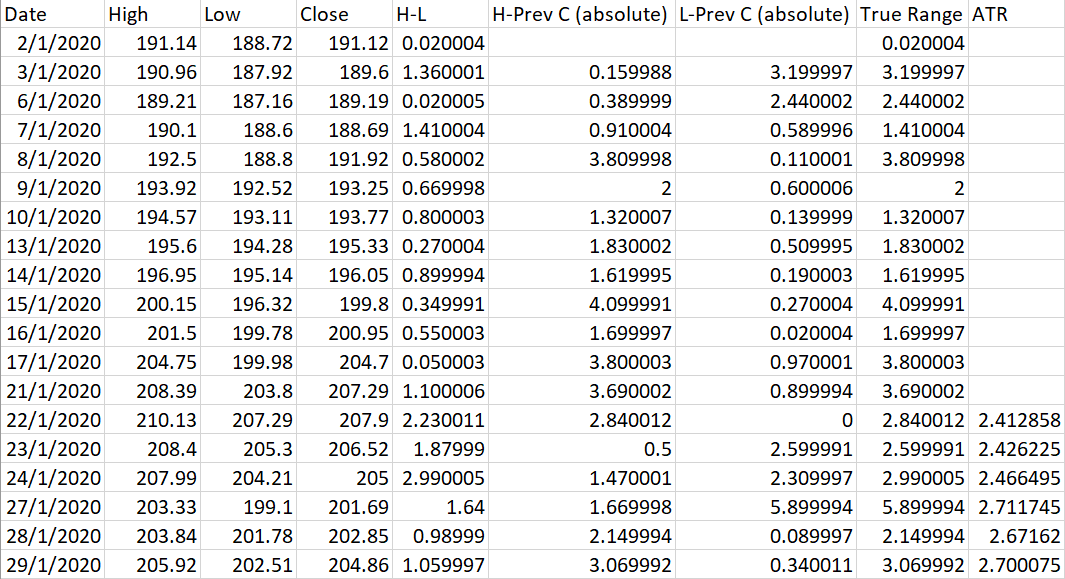
Above is an example of a calculation of Visa’s prices. Note that the ATR result will depend on the value of the 1st data you select.
I have good news for you! You don’t have to worry about the calculations because you can easily add the ATR indicator onto your chart on all good charting platforms.
Hover your cursor on the chart to get the ATR value for that period.
I will use the chart of Visa throughout this article.
3 Magical Ways You Can Use The ATR Indicator
#1 Setting a hard stop loss level
Frustrated over getting stopped out too often? Use the ATR indicator (the orange line at the bottom of the chart) to guide you in placing your stop loss level. That’ll give your trade more room to move around before it takes off.

Feel that 1 ATR is too tight? Set your stop loss level at 2 ATR away instead! Remember that the further your stop loss is, the smaller the position size you should take.
#2 Trailing your stop loss level
To use a trailing stop loss successfully, you need a wider stop loss (preferably 2 or more ATR).
Using a trailing stop loss is especially important when prices are moving in your direction and you want to protect as much gains as you can.
A trailing stop loss supports the idea of letting your profits run while cutting your losses short. How can you apply this?
Select a trailing ATR indicator that’s available in your charting platform.

Check the default parameters. Select a 14-period ATR and set the trailing ATR to be at least 2x). Sell when prices fall below the trailing ATR.
#3 Setting a realistic price target
Want to be a day trader? You need to set a realistic price level to take profits. How do you know where to set your price target? Yes! By checking out the ATR indicator.
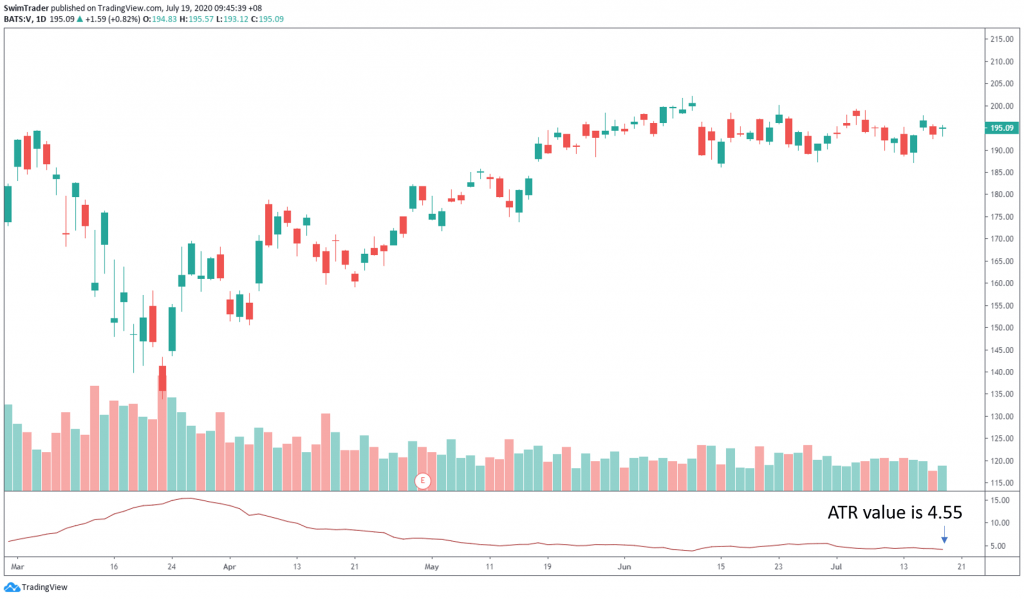
Let’s imagine that Visa is bullish on Mon. You buy Visa on the pullback.
The ATR reading is 4.55, suggesting that the price range will be about $4.55 on Mon, without any surprises.
You can set your 1st profit target about $4 away. Any price target that’s greater than $4.55 away will be less attainable.
Things You Must Remember
Set a stop loss that’s wide enough for the normal fluctuations in the stock market. This prevents you from being stopped up prematurely, only to see it fly without you.
You can also set a trailing stop loss right from the start, but it has to be wider. This will protect your profits as you allow the stock to continue trending.
The ATR indicator is also helpful in determining your profit target, especially when you are day trading.
Use the ATR indicator to maximize your profits and avoid getting stopped out too soon!
Here’s What You Can Do To Improve Your Trading Right Now:
#1 Register for our market outlook webinars by clicking here
#2 Join us in our Facebook Group as we can discuss the various ways of applying this by clicking here
#3 Never miss another market update; get it delivered to you via Telegram by clicking here
#4 Grab a front row seat and discover how you can expand your trading arsenal in our FREE courses (for a limited time only) by clicking here
Trade safe!
