
With 4 interest hikes planned for the US in 2022 and the surging number of COVID-19 cases around the world, the US stock market has been rocked. This has left many traders and investors worried. Is this the beginning of a crash?
In volatile times like this, it pays to have a look at companies with positive free cash flow and perform technical analysis on a longer timeframe (ie. looking at weekly charts as opposed to daily charts).
As I dug in to my research, I discovered this gem in the financial sector. This company has solid fundamentals and its weekly chart looks great!
What stock am I referring to? It’s none other than Arthur J Gallagher (AJG).
Fundamental Analysis
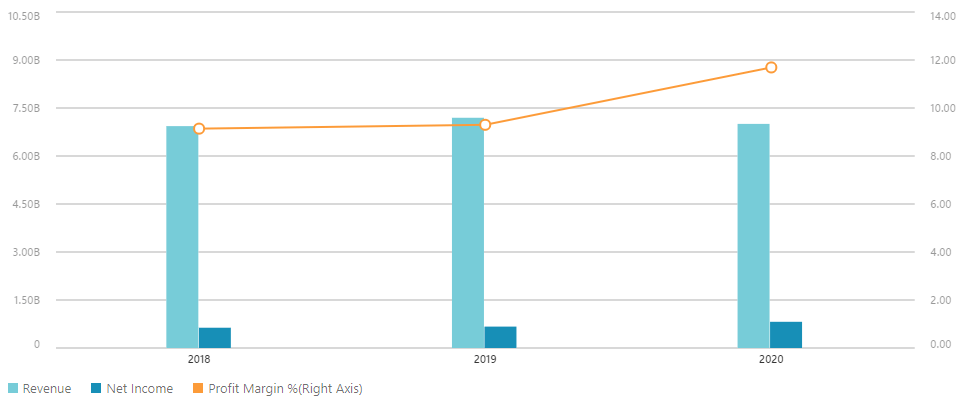
AJG’s profit margin has been growing year after year, while its revenue and net income remain steady in the midst of this pandemic.
Its cash flow has been growing by more than 32% year after year to $2.2b in 2020.
How does AJG compare against its industry peers?
AJG has outperformed its peers in all 7 key financial metrics. Of which, AJG has massively outperformed its industry peers by 2 or more times in 4 of the 7 financial metrics. Are you blown away?

This means that AJG’s business is highly sustainable and profitable.
Shall we look at the chart of AJG?
Big Picture
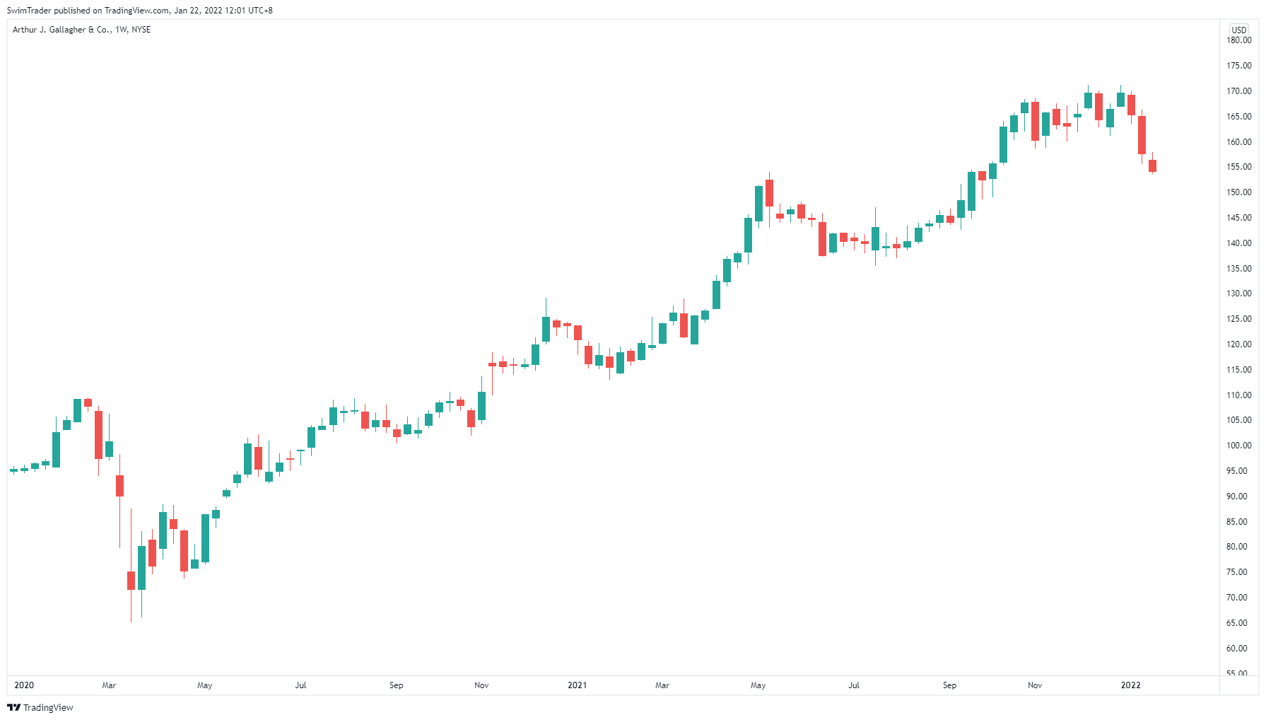
Here’s the weekly chart of AJG.
Though the price of AJG has been affected by the US stock market, the drop is healthy. AJG is still in a mighty uptrend!
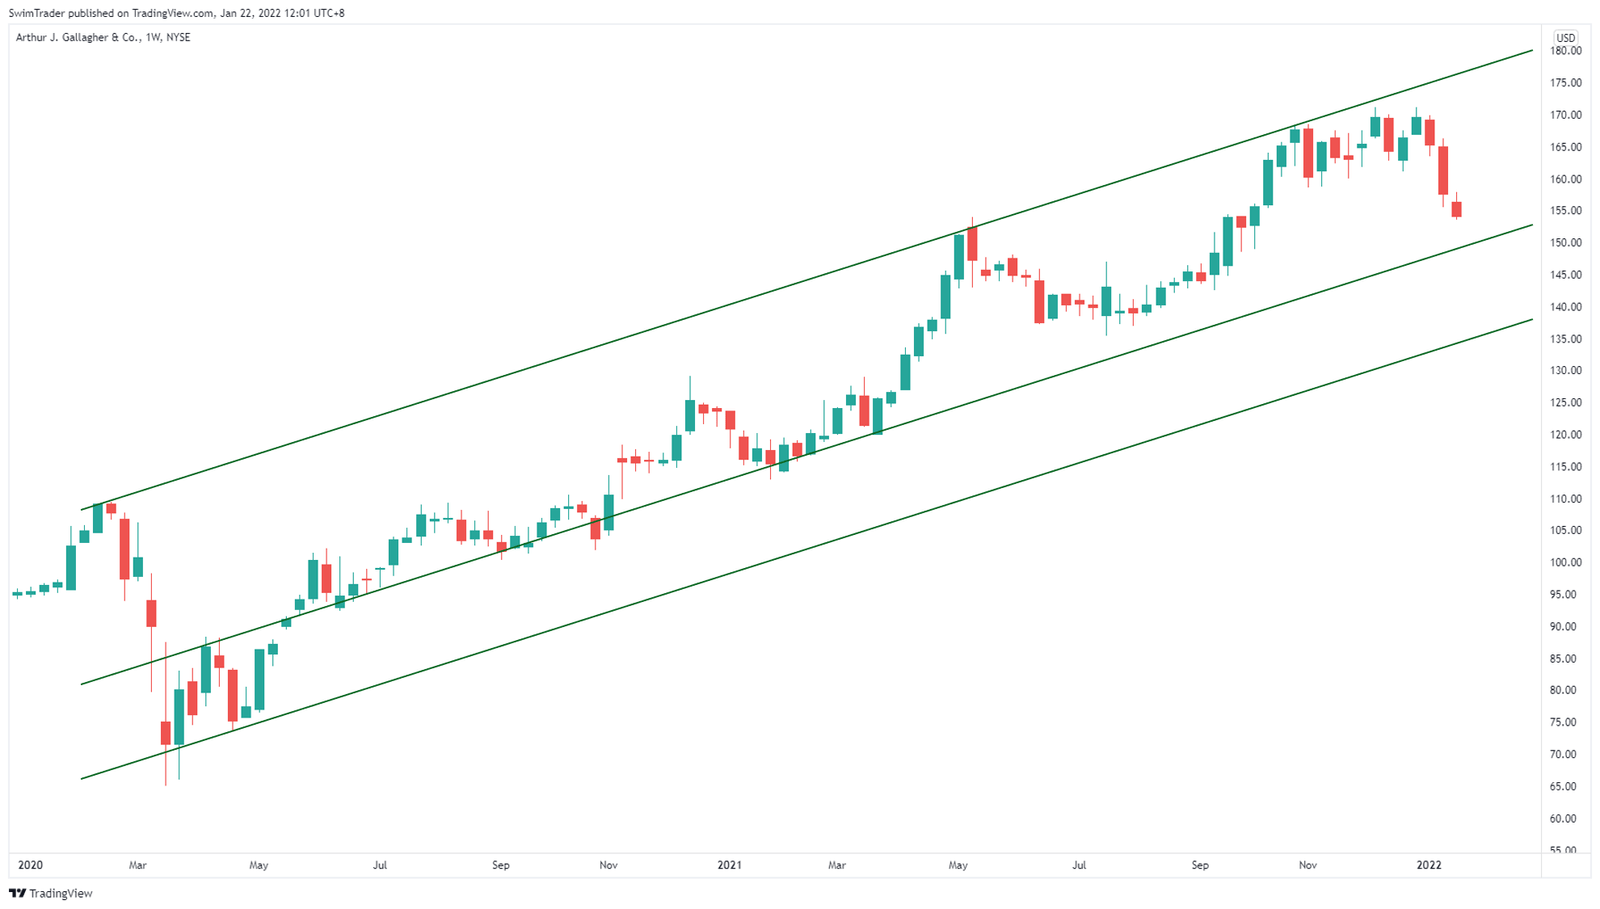
Let’s see if we can draw a couple of trendlines.
Do you see something?
Prices of AJG have been between the upper 2 trendlines since 2021. The last time prices touched the middle trendline was in late Mar 21, which was nearly 1 year ago!
Because the price of AJG is coming towards the middle trendline, nearing it, I’m excited. I see a buying opportunity soon.
Oh wait! There’s something else I need to add to the chart. Can you guess what it is?
You’re right! I need to mark out AJG’s support and resistance zones.
Key Price Levels

Yay! We’ve identified the support and resistance zones (blue horizontal lines) for AJG.
There’s an immediate support zone at $152, and a lower support zone at $139. An immediate resistance zone can be found at $170.
Support and resistance zones are important as they are psychological turning points that traders pay close attention to. To profit consistently from the stock market, you’ll need to know what other traders are thinking about and looking at.
Traders use support and resistance to evaluate if a stock is currently cheap or expensive too. This will determine if they should looking to buy or sell a stock.
Now that we have drawn the trendline and key price levels of AJG, let’s put on the TPB Swing Weekly indicators.
Technically Speaking
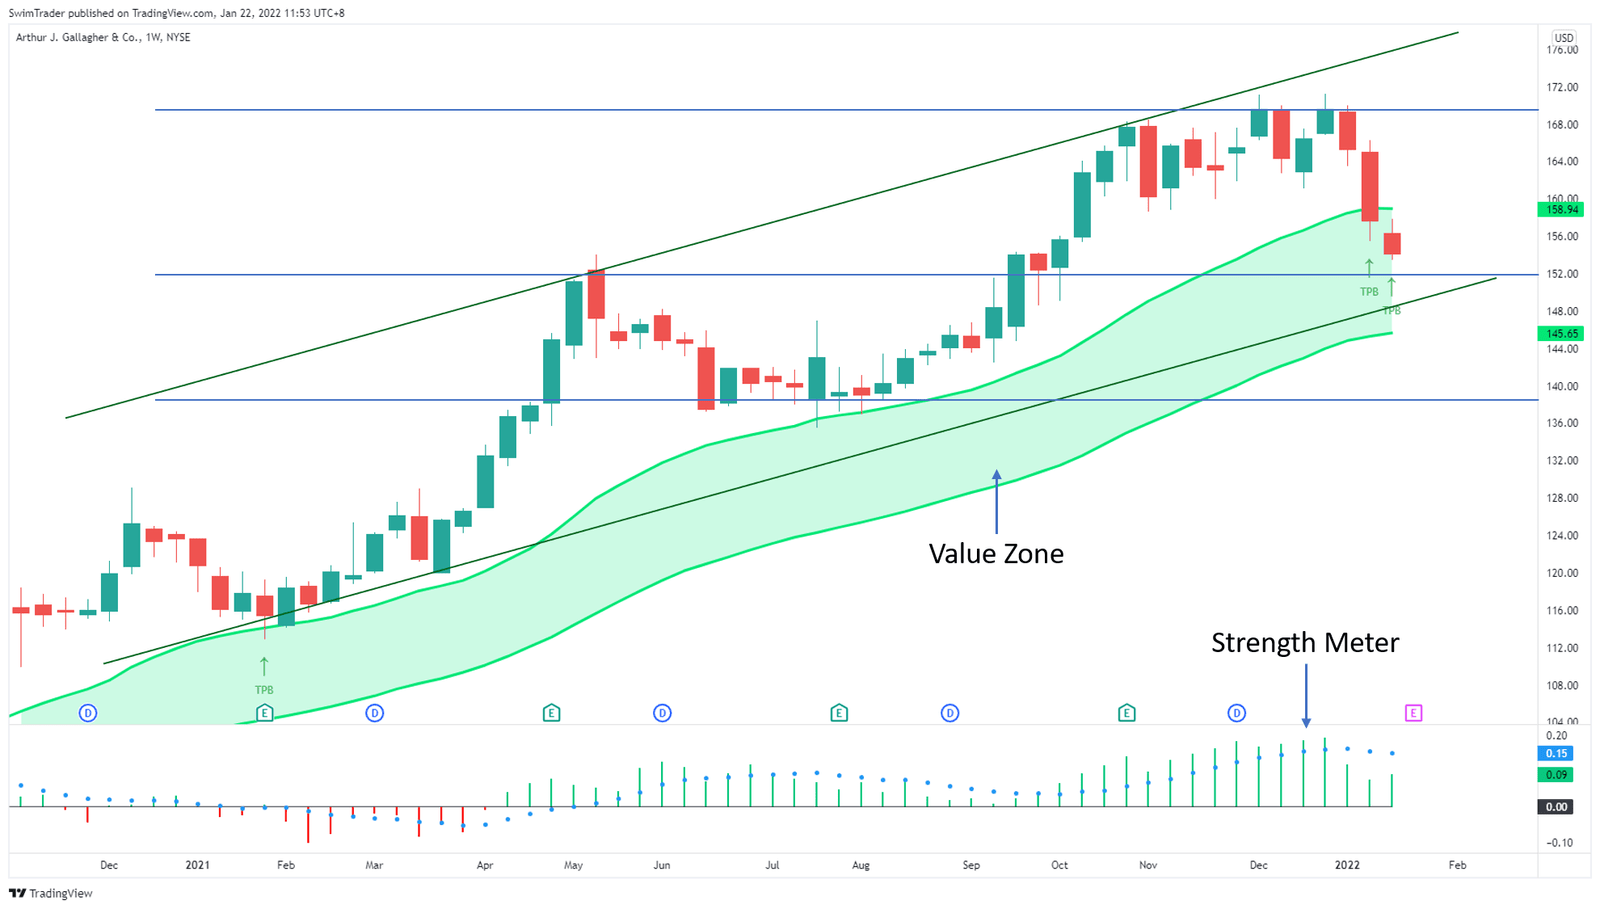
The weekly Value Zone and Strength Meter indicators are the bedrock of the TPB Swing Weekly strategy.
The Value Zone indicator is designed to act as a trampoline for prices to dip into and bounce up. It’ll tell you if the stock you’re analyzing is grossly overpriced or at a good value.
Do you see the green and red bars at the bottom of the chart? That’s the Strength Meter indicator to tell you if this stock is strong. Because buying strong stocks provide an additional edge in the stock market, you’d want the Strength Meter to be in green.
Years of data has been analyzed to formulate both indicators to help the TPB Swing Weekly strategy achieve a 71% win rate.
With that said, is it time to buy AJG?
Here are my thoughts.

Remember that the Value Zone indicator is like a trampoline? Therefore, I’ll not buy AJG right now. Instead, I’ll keep a close eye on AJG.
I’d want to see the price of AJG emerge from the Value Zone indicator. It’d be even better if the Strength Meter remains green in color. These should happen in the next week or 2.
Together with the TPB Swing Weekly strategy, you’ll get a list of potential stocks to save your time and increase your edge in the stock market.
With a proven strategy and an experienced community to support you in your trading journey, you’ve got nothing to lose.
Sign up for the TPB Swing strategy and enter the coupon code “win2022” for a $300 discount. This will end on 31 Jan 22, which is less than a week away! Hurry!
Why Is AJG The Stock Pick Of The Week?
![]()
As uncertainty looms over the economy, the stock market will be affected. It is therefore prudent to look for solid companies with strong fundamentals and technicals.
AJG is one of the brightest and strongest stocks, beating its competitors out of the water in all 7 key financial metrics, while looking very healthy technically.
This is why I think that AJG is the stock pick of the week.
Many thanks for having read this far. There’s 1 other thing you’ll need to know – I’m not a financial advisor, so please treat this article as education. Have fun conducting your research and I’d love to hear your thoughts in our Facebook Group.
Here’s What You Can Do To Improve Your Trading Right Now:
#1 Join us in our Facebook Group as we can discuss the various ways of applying this by clicking here
#2 Never miss another market update; get it delivered to you via Telegram by clicking here
#3 Grab a front row seat and discover how you can expand your trading arsenal in our FREE courses (for a limited time only) by clicking here
Trade safe!
