
“I wished that I’d stayed on riding the trend, selling my positions only later.” This is a common sigh from traders.
As price moves up and down, it can be tempting to sell your positions prematurely. The problem – how do you know if it isn’t the right time to sell?
This indicator does that.
It provides you with a HUGE advantage by capturing up to 85% of price movement!
Let’s explore what this indicator is and how you can use it to ride trends.
Keltner Channels Explained
What Is It?
The Keltner Channels indicator (KC) has 2 components demonstrated in the chart of Marsh & McLennan (MMC) below.
#1 A 20-period Exponential Moving Average (EMA)
Watch how different the Simple Moving Average is from the EMA.
#2 An upper and lower channel (similar to Bollinger Bands)
The upper and lower channels of the Keltner Channels indicator are based on Average True Range (ATR) while standard deviation is used for the bands in Bollinger Bands.

I’ll continue to use the chart of MMC below.
What Is It Used For?
The Keltner Channels are useful in identifying:
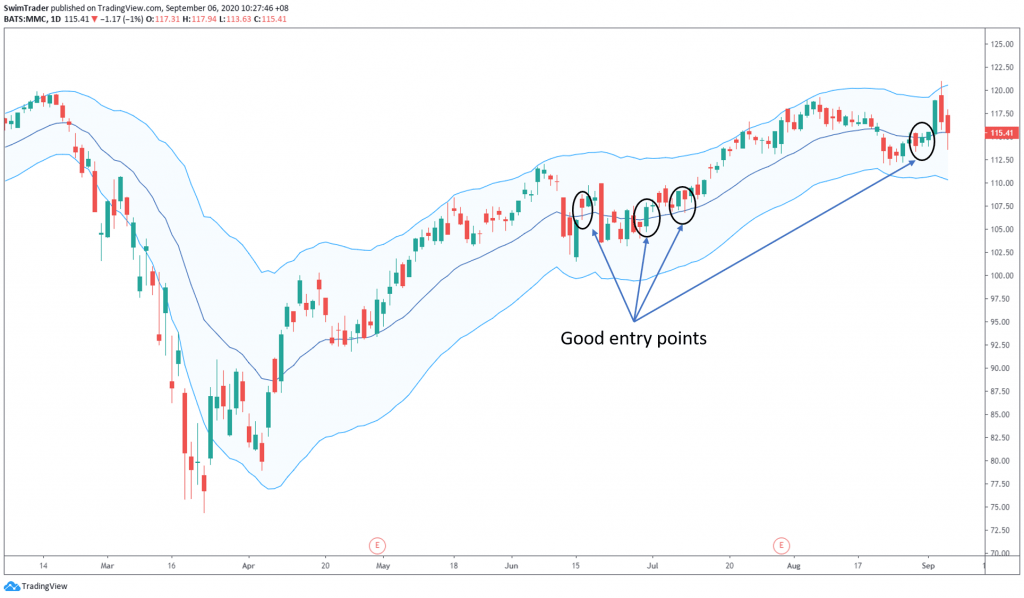
#1 Optimal entry points
#2 Optimal exit points
#3 Volatility
The wider the channels, the larger the volatility.
Geek Speak (skip this section if Math gets you dizzy)
How To Calculate Keltner Channels?
First, you’ll need to calculate the value of the 20-period EMA which can be found here.
With that, you are able to proceed in getting the values of the upper and lower channels using the formula below.

“A” is the coefficient which affects the width of the channels.
5 Ultimate Secrets To Trade And Ride The Trend
#1 Identify Your Entry Points
I like to look at stocks that are in a Type 1 market.
Learn about the 4 different types of market and the strategies you should use.
When prices are trending, they tend to retrace to the EMA (20). Prices also tend to find support at the EMA (20) before continuing moving.
#2 Determine Your Profit Target
This indicator covers 85% of price movement when a good ATR coefficient is used. I will share about this in the next point.
Since a good width between the channels covers most of the price movement, you’ll be able to set an accurate target price. This allows you to capture the majority of a trend, maximizing your profits.
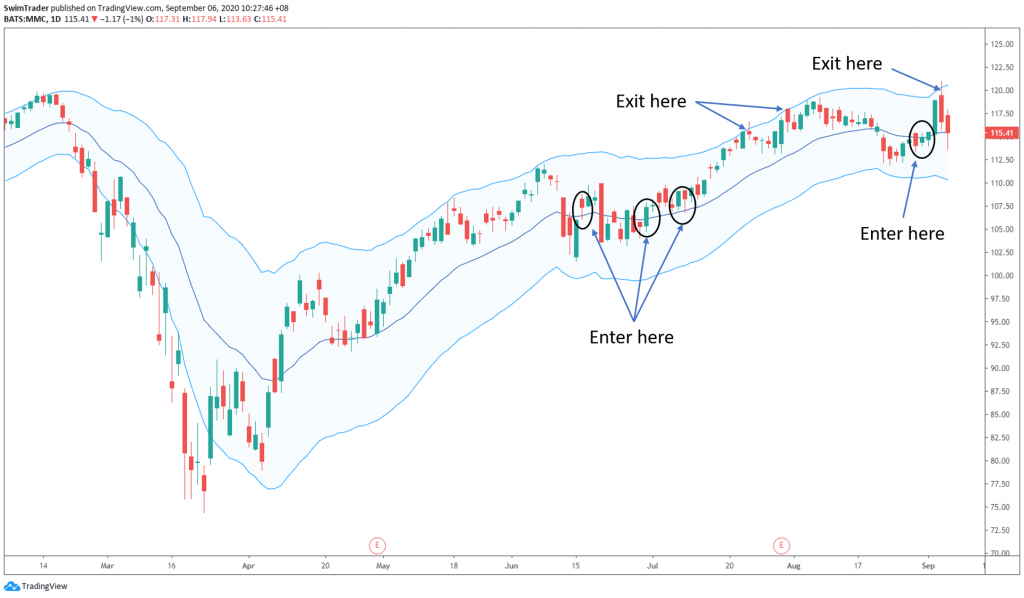
As you can tell from the chart above, a good target price to sell will be at the top of the upper channel.
You can even let price break out of the upper channel, but you must quickly sell when price re-enters the upper channel. This is because it is a warning that momentum is decreasing and prices may drop soon.
#3 Know The Ideal ATR Coefficient
A good coefficient to use is between 2 and 2.25.
In this article, I have used the coefficient of 2.25.
Feel free to play around and experiment the coefficient. The main idea is to have the Keltner Channels capture 85% of the price movement.
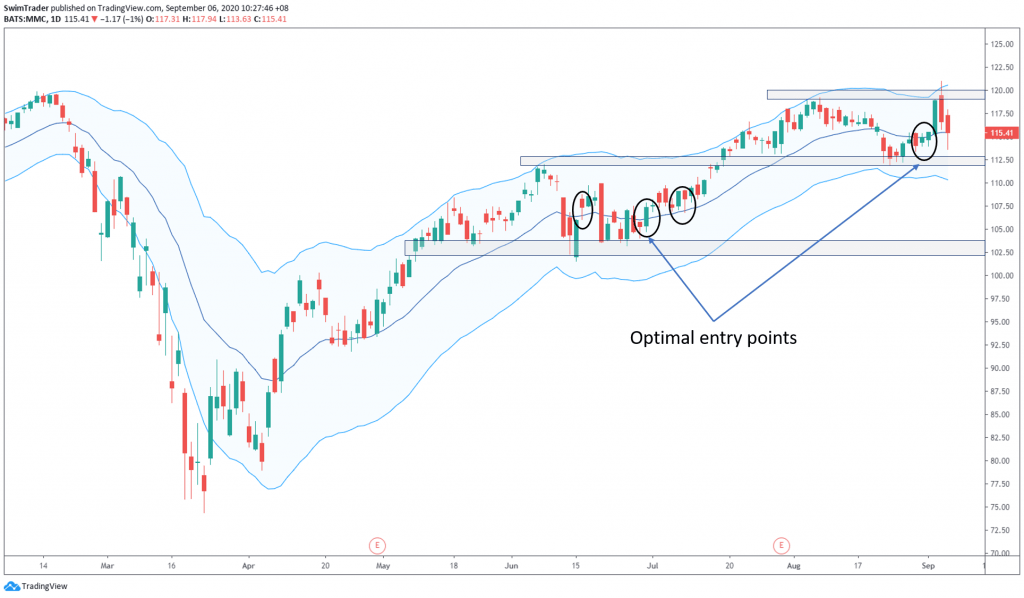
#4 Include Support And Resistance

By buying at the areas of confluence between the Keltner Channels indicator and support and resistance, you have an added edge.
Circled are the good entry points based on the Keltner Channels indicator alone (see Ultimate Secret #1). 2 out of these 3 circled entry points are optimal as shown in the chart above. This is because prices were nearer to the support which means that your stop loss level won’t be too far away. This ultimately translates to a higher chance of making more money.
#5 Include Knowledge On Candlesticks
Your knowledge of candlesticks combined with the Keltner Channels indicator and support and resistance will leave you with the best of the best entry points.
In a volatile market, the channels are further from each other (see the month of Apr). Applying position sizing, you’ll want to trade fewer shares in a volatile market.
5 Things You Must Remember About Keltner Channel

#1 Identify your entry points for a greater chance of success
#2 Determine your profit target so that you avoid getting caught in a reversal
#3 Know the ideal ATR coefficient to use to capture most of the price movements
#4 Include support and resistance to strengthen your chance of success
#5 Include your knowledge on candlestick patterns to trade with even greater certainty
Here’s What You Can Do To Improve Your Trading Right Now:
#1 Register for our market outlook webinars by clicking here
#2 Join us in our Facebook Group as we can discuss the various ways of applying this by clicking here
#3 Never miss another market update; get it delivered to you via Telegram by clicking here
#4 Grab a front row seat and discover how you can expand your trading arsenal in our FREE courses (for a limited time only) by clicking here
Trade safe!
