
You bought your dream car. A week later, there’s a sale and you could’ve saved $5,000. Your heart aches.
In a bull run, there’re often signs of a temporary pause to a price rally or a short decline in prices. You’ll want to identify these signs to save you your hard earned money and time. What are these signs? What are these candlestick patterns?
#1 Hanging Man
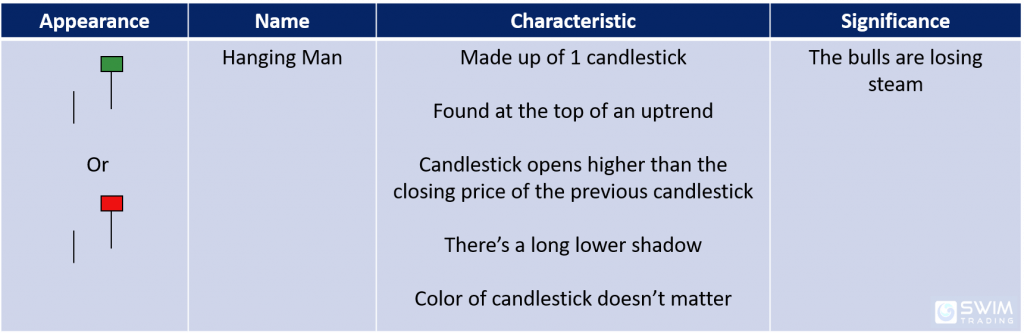
As with the other candlestick patterns, the vertical line before the Hanging Man candlestick pattern represents the range of the previous candle. The previous candle’s color, shape and size are not important. The most important thing is that it is trending up.
For a candlestick to be qualified as a Hanging Man pattern, it has to be seen at the top of an uptrend.
Trading Psychology
The Hanging Man candlestick pattern is quite common. It appeared on the chart of FND in early Sep 2020. Let’s study it together.

Prices were rising, making new highs. In early Sep 2020, prices gapped up at the opening. The bulls were still very much in control.
As the day passes, the bears took control. The bears came in strong and pushed prices down, close to the opening price level of the previous day. The bulls came back and fought valiantly as they pushed prices back up. The day ended with the bears winning, albeit a tiny victory.
The bears continued to take control for the next 2 days before the bulls re-entered to fight. This massive fight led to a consolidation which lasted for 5 weeks!
#2 Inverted Hammer
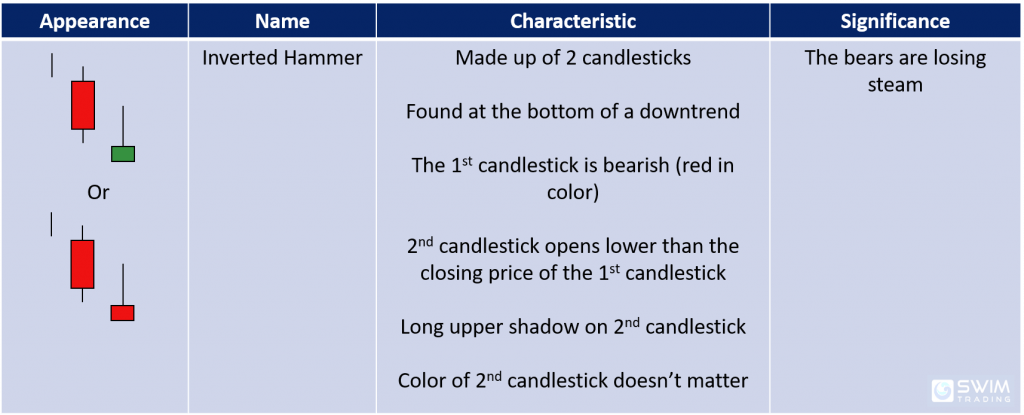
As with the other candlestick patterns, the vertical line before the Inverted Hammer candlestick pattern represents the range of the previous candle. The previous candle’s color, shape and size are not important. The most important thing is that it is trending down.
For it to be qualified as an Inverted Hammer pattern, it has to be seen at the bottom of a downtrend.
Trading Psychology
The Inverted Hammer candlestick pattern appeared on the chart of TWTR in early Sep 2020. What’s the psychology behind this?
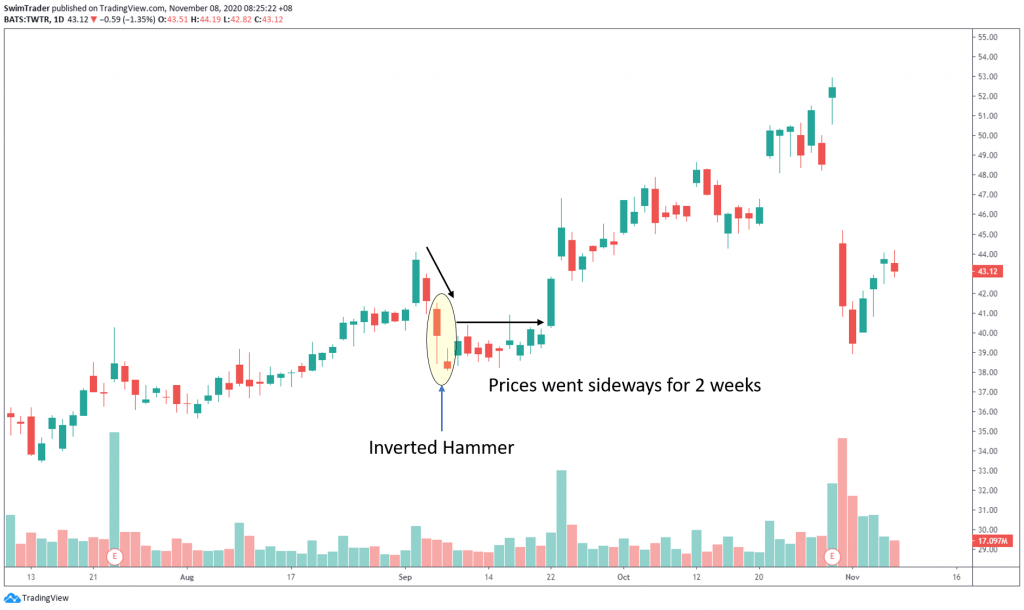
Prices were rising steadily until a drop in early Sep 2020. Prices continued to fall quickly; the bears crashed the party and gained full control. This can be seen from the gap down.
The bulls crept back as prices were pushed up in the 1st candlestick. The overall sentiment was still bearish as the 1st candlestick had closed lower than its opening price.
Similar to the 1st candlestick, the 2nd candlestick gapped down. The bulls tried to launch a defense but failed as the bears managed to press prices down, to close lower.
However, this is a sign that the bears are soon to lose control because the bulls are not giving up easily without a tough fight. This resulted in a sideways movement for 2 weeks before the bulls eventually regained control.
#3 Stalled Pattern
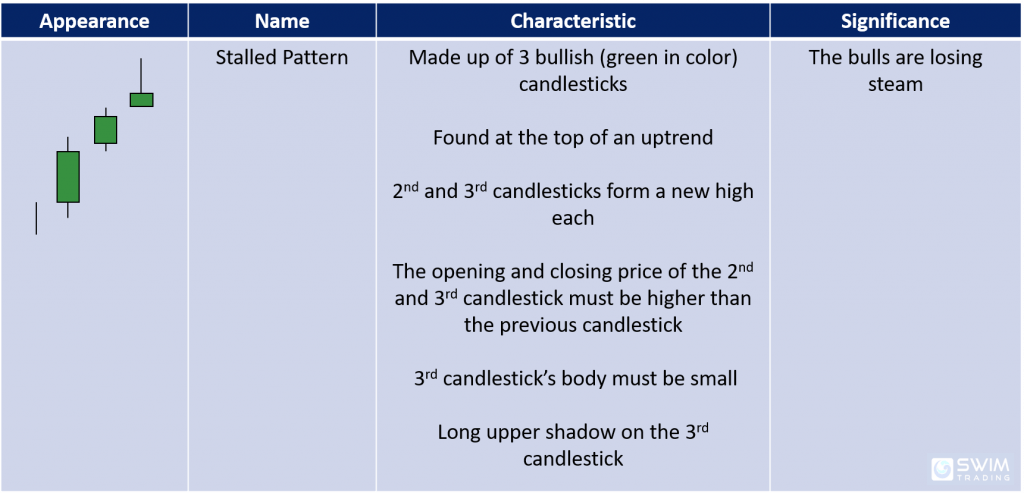
The vertical line before the Stalled Pattern candlestick pattern represents the range of the previous candle. The previous candle’s color, shape and size are not important. The most important thing is that it is trending up.
It is important to note that the 3rd candlestick’s body must be small. The 3rd candlestick must also have a long upper shadow.
Trading Psychology
Let’s have a look at the chart of DE when the Stalled Pattern appeared in earl Aug 2020.

Prices were rising sharply. Bullish gaps were common. Even the 1st candlestick of the Stalled Pattern candlestick pattern opened with a gap up. This indicated that the bulls were in total control and very strong.
A gap up continued on the 2nd candlestick, forming a new high. This reaffirms the bullishness sentiment.
The 3rd candlestick also gapped up. The bulls continued to push prices higher and a new high was formed. This, however, is an exhaustion gap.
However, this was not to last. The bears appeared. They managed to press the prices lower, resulting in a long upper shadow.
The bears were strong too, as highlighted by the short body of the 3rd candlestick. Though the bulls won that day, they barely survived the onslaught by the bears.
Prices dropped a little after the Stalled Pattern was formed and consolidated for 1.5 weeks. The bulls found their footing once again and the bull market was back.
#4 Advance Block
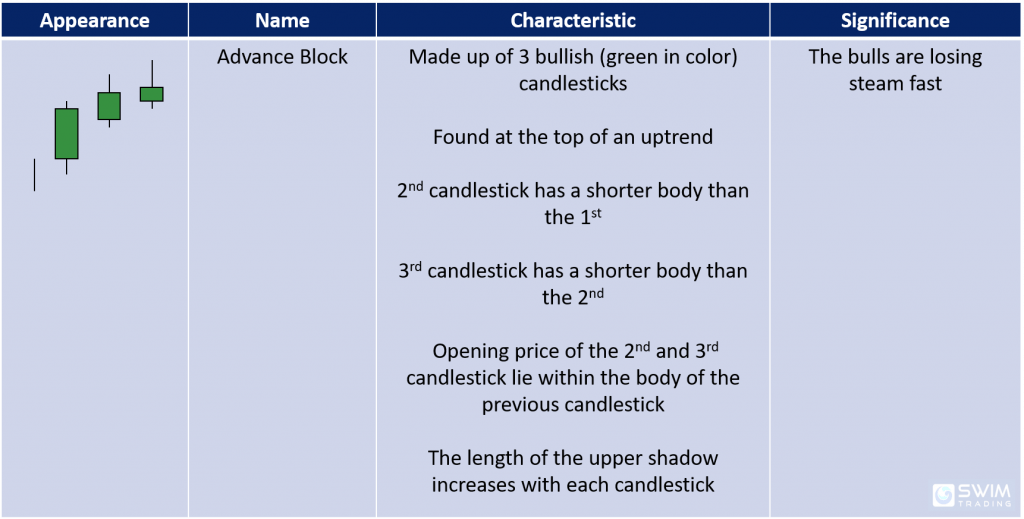
The vertical line before the Advance Block candlestick pattern represents the range of the previous candle. The previous candle’s color, shape and size are not important. The most important thing is that it is trending up.
The 2nd and 3rd candlestick must open below the closing price of the previous candlestick. The length of their bodies must decrease in height while the upper shadow must increase in length.
Trading Psychology
The Advance Block pattern appeared on the chart of NEE in late May 2020. Let’s look at the psychology as this pattern was formed.
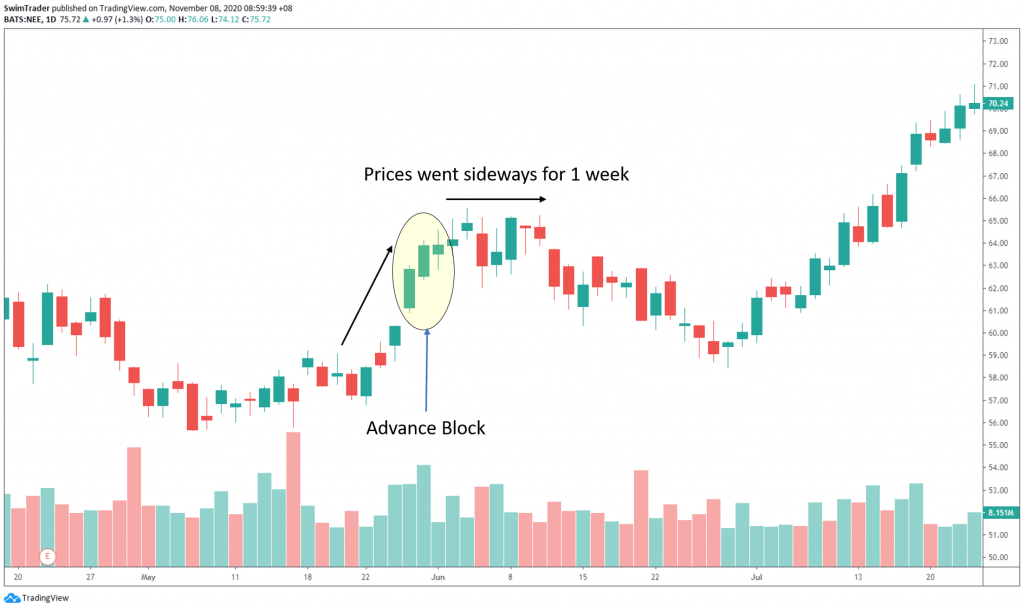
Prices were climbing rapidly. This is shown by the gap up on the opening price of the 1st candlestick. The bulls were in firm control.
However, there were signs that the bears are starting to creep in. First, the 2nd candlestick opened lower than the closing price of the 1st candlestick; there was a tiny gap down. Second, the body length of the 2nd candlestick is shorter than the 1st.
The 3rd candlestick flags out more red flags. It has gapped down. The bears were growing in strength as they managed to push prices down initially. The bulls fought and made sure that they won, even by a small margin (shown by the tiny body of the 3rd candlestick).
Prices consolidated immediately after. This lasted for a week.
You must be thinking “What are the subtle differences between the Advance Block, Stalled Pattern, and Three White Soldiers candlestick patterns?”. The answer lies in the gaps, size of their bodies, and the tendency to reverse or consolidate.
Check out the characteristics of the Three White Soldier candlestick pattern here.
Candlestick Patterns Recap
Can you remember the names of the 8 candlesticks patterns you have learnt in Part 1 and Part 2? They are:
#1 Bullish Harami
#2 Bearish Harami
#3 Bullish Doji
#4 Bearish Doji
#5 Hanging Man
#6 Inverted Hammer
#7 Stalled Pattern
#8 Advance Block
Bear in mind that a consolidation is likely to happen after any of these candlestick patterns appear. It pays to wait for a breakout or breakdown in prices before entering your positions.
Opportunity cost can be costly as you could’ve been making money by buying a stock that’s rising than being stuck in a stock that’s ranging.
Here’s What You Can Do To Improve Your Trading Right Now:
#1 Register for our market outlook webinars by clicking here
#2 Join us in our Facebook Group as we can discuss the various ways of applying this by clicking here
#3 Never miss another market update; get it delivered to you via Telegram by clicking here
#4 Grab a front row seat and discover how you can expand your trading arsenal in our FREE courses (for a limited time only) by clicking here
Trade safe!
