
We have been looking at bullish reversals previously.
What about bearish ones?
Definitely there are bearish reversal candlestick patterns that can give us an edge in trading the downside when the market is bearish or protect our profits when the market is bullish.
In the next few articles, you will learn how to identify bearish reversal candlestick patterns.
We’ll explore 3 bearish reversal candlestick patterns in this article.
Recall – Common Misconception
Once again, recall that when you see a reversal candlestick pattern, it doesn’t mean an immediate change to the trend.
If you missed that article, check out the common misconception highlighted here.
When a bearish reversal pattern occurs, 3 possible scenarios can happen:
#1 Change immediately from a uptrend to a downtrend;
#2 Change from an uptrend to a range;
#3 Resumes the direction of its previous trend ie downtrend resumes
Always remember that the trend is your friend, so only trade with the trend.
Now that you recall this common misconception, you’re ready to proceed to discover these 3 bearish reversal candlestick patterns!
#1 Shooting Star
From the table below, you’ll learn of the 3 characteristics of a shooting star candlestick and its significance.
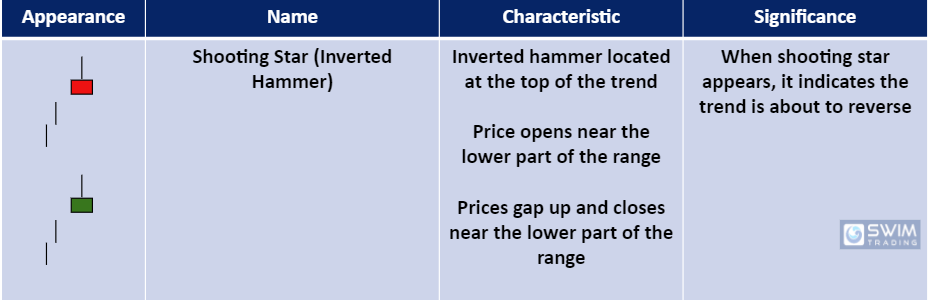
A shooting star looks like an inverted hammer but it is located at the top of the trend.
Regardless of the color of the candle, at the top of an uptrend, prices gap up and finish a volatile session with prices open and closing near the lower part of the range.
Trading Psychology
Regardless of the candle color, prices gap up to indicate price continuation.
However, prices finished at the bottom part of the range, this gives us a hint that bulls are not that strong.
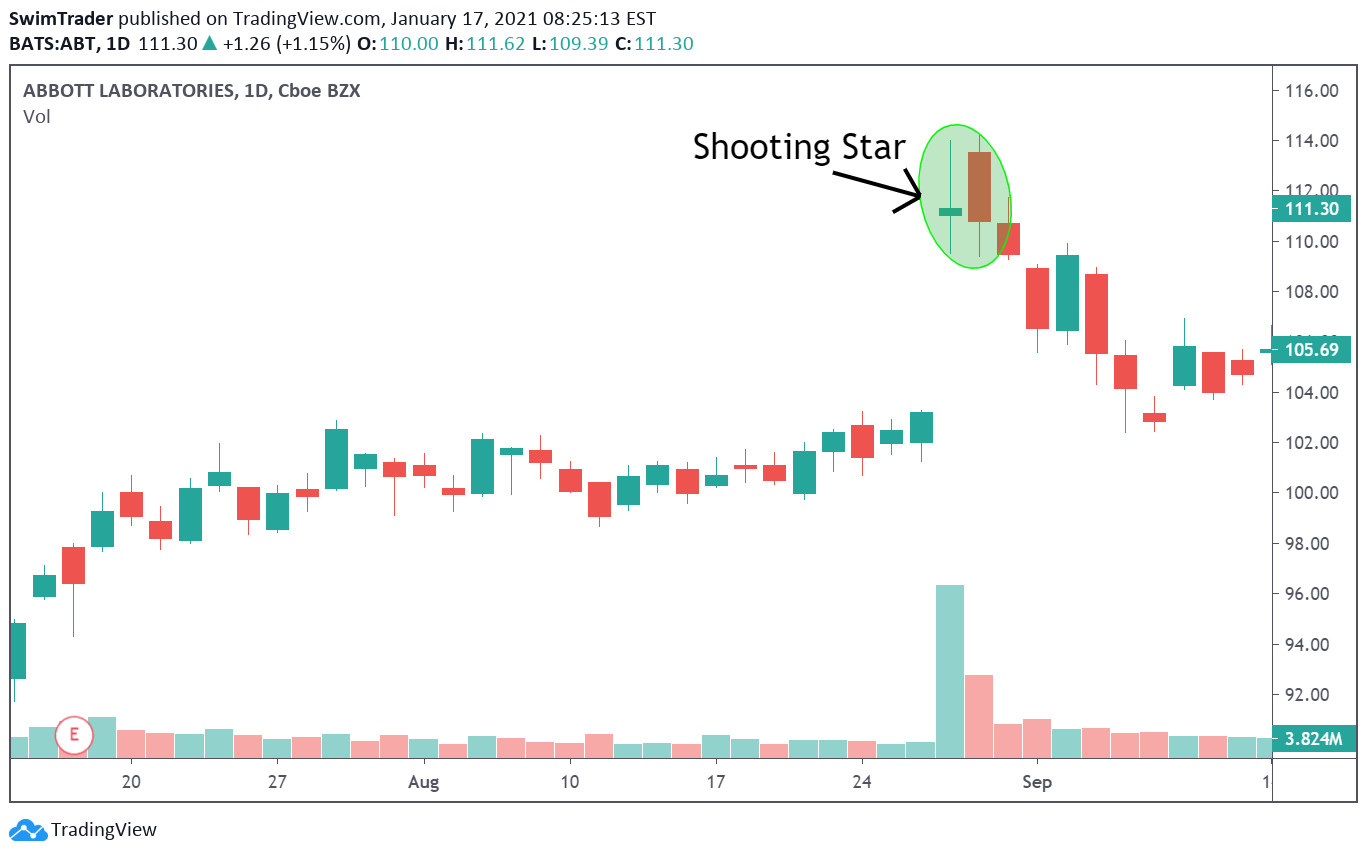
The image above shows a shooting star, prices gapped up and closed at the lower half of the candle session.
Notice the high volume as well.
Yet, the volume was not able to continue this bullish momentum.
Prices went on to reverse and close the gap the next few days.
Usually accompanied with higher than average volumes and volatility.
#2 Bearish Belt Hold
From the table below, you’ll learn of the 3 characteristics of a Bearish Belt Hold candlestick pattern and its significance.
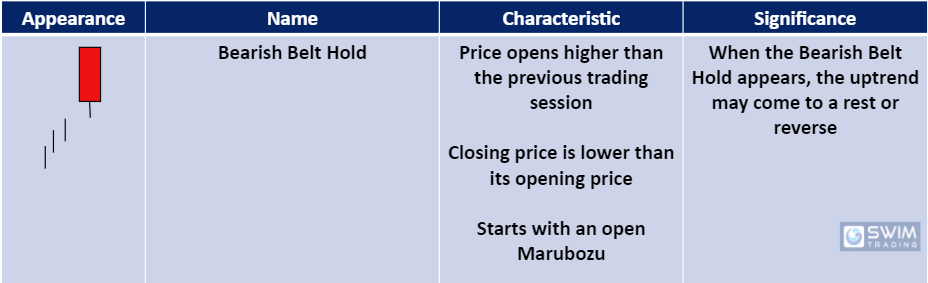
Note that the opening price of the Marabozu must be above the previous candle’s closing price (ie there’s a gap up).
This chart pattern must also be formed at a high.
Prices gap up and and move down immediately, closing lower in a wide range session.
Trading Psychology

Prices of AAP gapped up and closed down.
It was a huge bearish session. Next few sessions continued downwards thereafter.
This is also accompanied with high volume, indicating participants are convicted to go bearish.
This huge bearish candlestick is a strong warning sign for swing traders who are looking to profit from the current swing up.
#3 Bearish Engulfing
You’ll learn of the 3 characteristics of a Bearish Engulfing candlestick pattern and its significance from the table below.

For a Bearish Engulfing candlestick pattern to be a valid bearish reversal, its opening price must be above the previous candle’s closing price (ie there’s a gap up).
This chart pattern must also be formed at a high.
A bullish candle appears at the top of an uptrend.
A gap up follows the next day and reverses into a long bearish session which engulfs the entire range of the bullish candle.
Trading Psychology

After a doji at the top of the uptrend, prices gapped up and reversed down.
With the bearish candle engulfing the previous bullish candle, this indicates a strong change in sentiment.
Prices went south thereafter.
3 Things You Must Remember About These Candlestick Patterns
#1 There must be a gap up
#2 Prices may pull back for a short while before a new downtrend forms
#3 An immediate bearish reversal may happen
Come back next week for Part 2 where I’ll share more bearish reversal candlestick patterns which you can profit from!
Here’s What You Can Do To Improve Your Trading Right Now:
#1 Register for our market outlook webinars by clicking here
#2 Join us in our Facebook Group as we can discuss the various ways of applying this by clicking here
#3 Never miss another market update; get it delivered to you via Telegram by clicking here
#4 Grab a front row seat and discover how you can expand your trading arsenal in our FREE courses (for a limited time only) by clicking here
Trade safe!
