
Stuck in traffic for 5 hours??
That’s what I heard from a friend who drove to Malaysia on Thursday night, the eve of Vesak day.
Over the long weekend, I’ve seen many photos of my friends abroad and having a great time.
I hope you had a refreshing time too!
![]()
Source: Source: ir.crowdstrike.com/static-files/547e5c92-3594-4eef-9dfc-9eca37b635f4
Last week, I shared my thoughts on the share price of CrowdStrike (CRWD). I was expecting a pullback and it came.
However, I think that the pullback isn’t over. We may see its price drop a little more to ~$138 before bouncing higher.
This week’s swing trading opportunity, ANSYS, is also likely to pullback a little before rising.
Shall we dive right into analyzing ANSYS?
Performance Of US Stock Market vs ANSYS (ANSS)
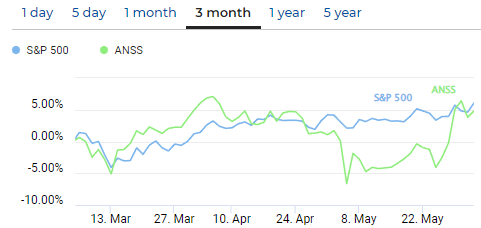
From the comparison chart above, you can see that the performance of ANSYS’ shares enjoyed periods of outperformance against the S&P 500.
Is this a cause for concern?
I don’t think so as ANSYS’ shares have been rallying hard over the past 2 weeks, catching up with the performance of the S&P 500.
Besides, the share price of ANSYS is trending higher!
Is there anything else to consider?
How Explosive Is ANSYS (ANSS)?
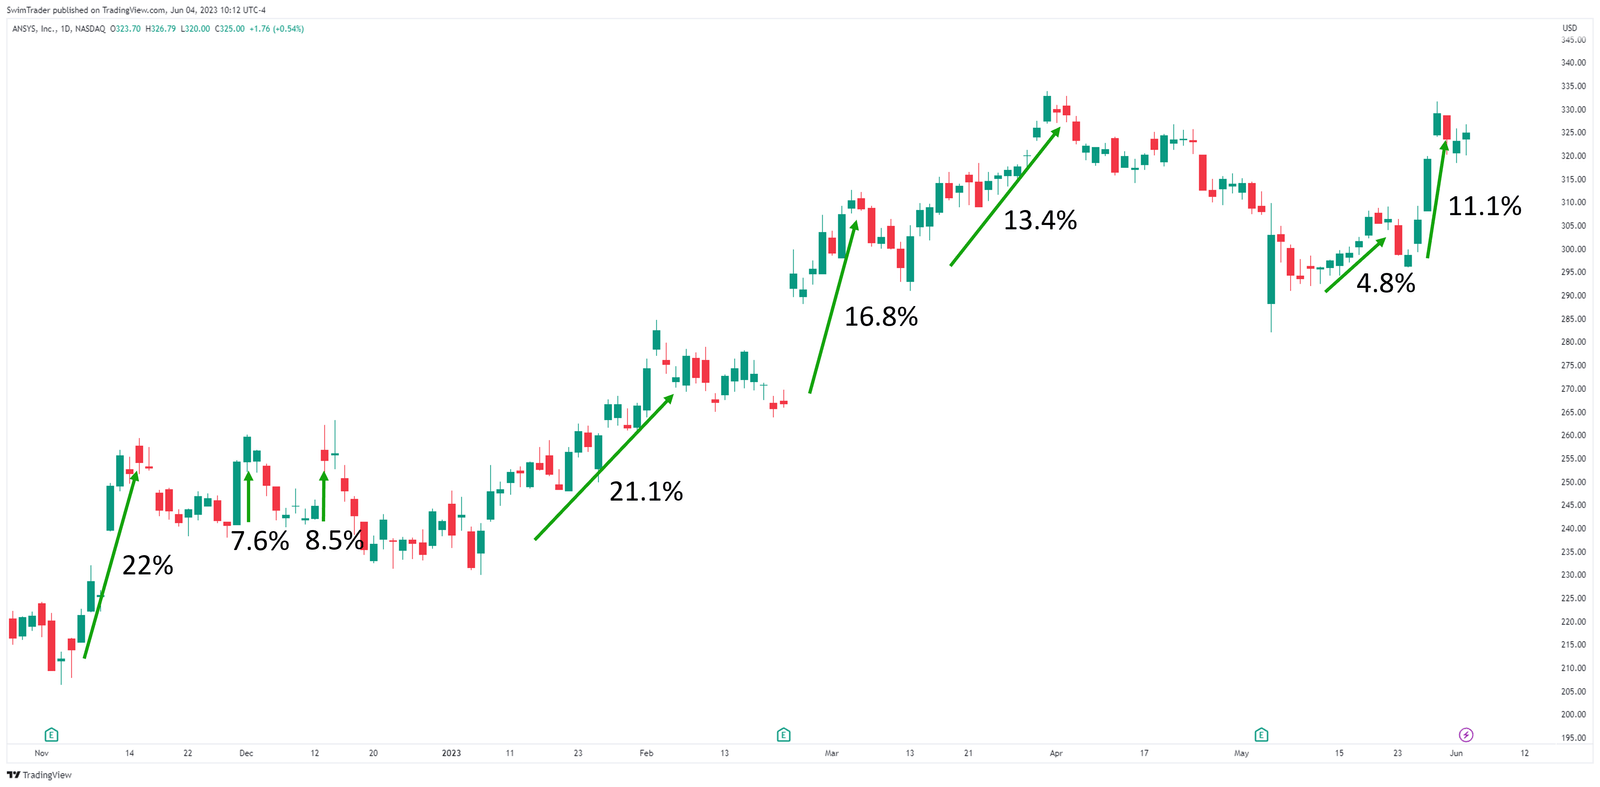
You’ll want to find out if the shares of ANSYS have been exploding in price consistently to make full use of your trading capital.
In the past 7 months, the shares of ANSYS have exploded upwards 8 times!
And these up moves of between 4.8% and 22% are even more significant when you realize that ANSYS has a huge market capitalization of $28b!
ANSYS’ shares have the capability to explode in price. Therefore, you’ll want to analyze further to determine an opportune moment for a swing trade.
Let’s do just that in the next section.
Key Price Levels

Uncovering the key price levels of any financial asset is crucial to know where the demand and supply zones are.
In other words, key price levels are support and resistance zones.
Looking at the chart of ANSYS above, you can see an immediate resistance zone at ~$330, and an immediate support zone at ~$309.
I see 2 possible scenarios.
Scenario 1: Shares of ANSYS rise and break above $330.
Scenario 2: Shares of ANSYS fall to $309.
Which scenario do you think is more likely to happen?
I think that scenario 1 is more probable.
The Strategy You Can Use To Swing Trade ANSYS (ANSS)
After comparing the performance of ANSS with the broader US stock market, determining whether ANSS has experienced explosive up moves, and identifying its key price levels, it’s time to talk strategy.
To stay in business, you must know your entry, profit taking, and stop loss levels in every trading strategy. Yes, trading is a business, which means that your strategy must be well thought out.
Using The Art of Explosive Profits (AEP) framework, I’d like to see ANSS break above $330 before considering an entry for a swing trade.
As the name implies, you’ll be looking to consistently catch an explosive move in a short period of time.
Instead of relying on news and hearsay, the AEP course will teach you how to screen stocks for swing trading like ANSS.
You’ll also learn how to read charts and identify stocks that are about to make a big move.
Finally, you’ll learn how to identify the optimal entry, stop loss, and take profit levels to capitalize on these explosive moves (in a safe manner, of course)!
Can you apply the AEP framework to provide you with a side income while working full time?
Yes, you can!
Come, have a look at the AEP framework and incorporate this explosive trading strategy into your arsenal to capitalize on more swing trading opportunities.
Why Is Swing Trading ANSS Worth It?
![]()
Source: ansys.com
ANSS has outperformed the S&P 500 in the recent past and could do so again.
Its share price has demonstrated the ability to explode upwards, generating sizable gains, making it a worthy swing trading candidate.
A good entry could be here in the next few days, so you won’t have to wait long.
While we wait for the breakout, please keep in mind that I’m not a financial advisor, so please treat this as edutainment and conduct your own research.
Lastly, all images are from pexels.com, pixabay.com, sectorspdrs.com, tradingview.com, and unsplash.com.
Here’s What You Can Do To Improve Your Trading Right Now:
#1 Join us in our Facebook Group where we discuss the various ways of applying this by clicking here.
#2 Get market updates delivered to you via Telegram by clicking here.
#3 Grab a front row seat and discover how you can expand your trading arsenal in our FREE courses (for a limited time only) by clicking here.
Trade safe!
